

Managing a modern software-defined network means navigating a multi-layered architecture. When network traffic goes missing between overlays, distributed firewalls, and physical handoffs, many engineers still default to traditional troubleshooting methods – SSHing into ESXi hosts and Edge Nodes, running pktcap-uw, or digging through esxcli outputs.
While those tools are vital, they are also time-consuming. NSX Traceflow has been a native feature in your VCF virtual networking stack for a while, but it remains an underutilized tool in the arsenal. Traceflow isn’t just a graphical traceroute. Unlike a traditional traceroute that relies on the guest OS to generate a packet and waits for ICMP “Time Exceeded” messages from physical routers, Traceflow injects a specially tagged, synthetic packet directly into the hypervisor’s data plane and monitors the relevant NSX observation points in the forwarding path.
It doesn’t rely on ICMP. Instead, every NSX virtual networking component that touches the packet – from the Distributed Firewall (DFW) to logical NAT rules – reads the tag and reports its exact action directly to the NSX Manager.
Here are 5 ways you should be using NSX Traceflow:
1. Test Inbound Network Connectivity (Ingress Through the Tier-0 Router)
In addition to East-West traffic testing, Traceflow can be used to test North-South ingress traffic originating from outside the virtual network.
- The Use Case: You need to verify if traffic from an external client on the physical network can reach a specific internal virtual destination, such as a newly deployed web server.
- How it Works: Traceflow allows you to inject synthetic traffic directly on the Tier-0 (T0) uplinks that connect to the physical network. You can specify an external IP address as the source. Traceflow will push the packet through the T0 ingress port and track its journey down through the Tier-1 router, any Edge and ESX nodes in the path, the Distributed Firewall (DFW), and ultimately to the destination VM.
If external users are reporting connectivity failures, this is the fastest way to prove whether the virtual networking and routing topology is accepting and routing the inbound traffic correctly.
Inbound Traceflow Example and Output
Let’s look at how to configure an inbound trace targeting a VM on an overlay segment. The goal is to validate the routing and forwarding path for traffic originating from outside the virtual networks.
To set this up, configure the Traceflow Source to use a Tier-0 Edge Uplink port. Then, manually override the source IP address field to represent an external client – for example, 8.8.8.8. You can swap this out for any routable public or corporate IP address you want to simulate.
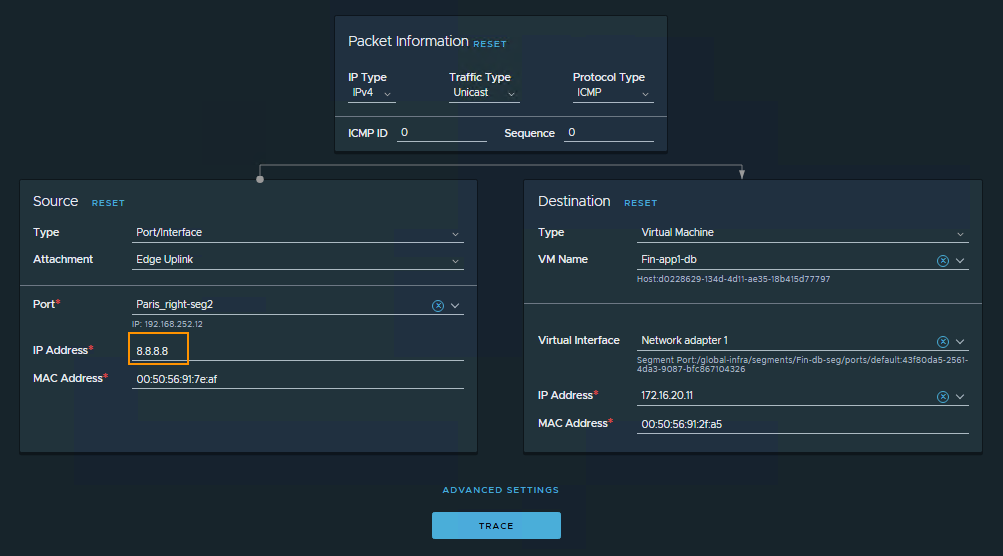
For this synthetic injection to work, there are two strict routing requirements you must meet:
- Routing to the Destination: Ensure you select an uplink port on the correct Tier-0 gateway that has a route to the subnet where the destination VM resides.
- Reverse Path Forwarding (RPF) Checks: The Tier-0 gateway must have a route to the source IP (i.e. traffic leaving the environment must know how to reach 8.8.8.8), otherwise the packet will be dropped by the Tier-0’s Reverse Path Forwarding (RPF) check, and your observation table will show a “Dropped by IP” error. If you are just running an isolated test and the environment doesn’t have a route for the source IP or a default route, you can temporarily work around this by disabling the RPF check on the Tier-0 interface.
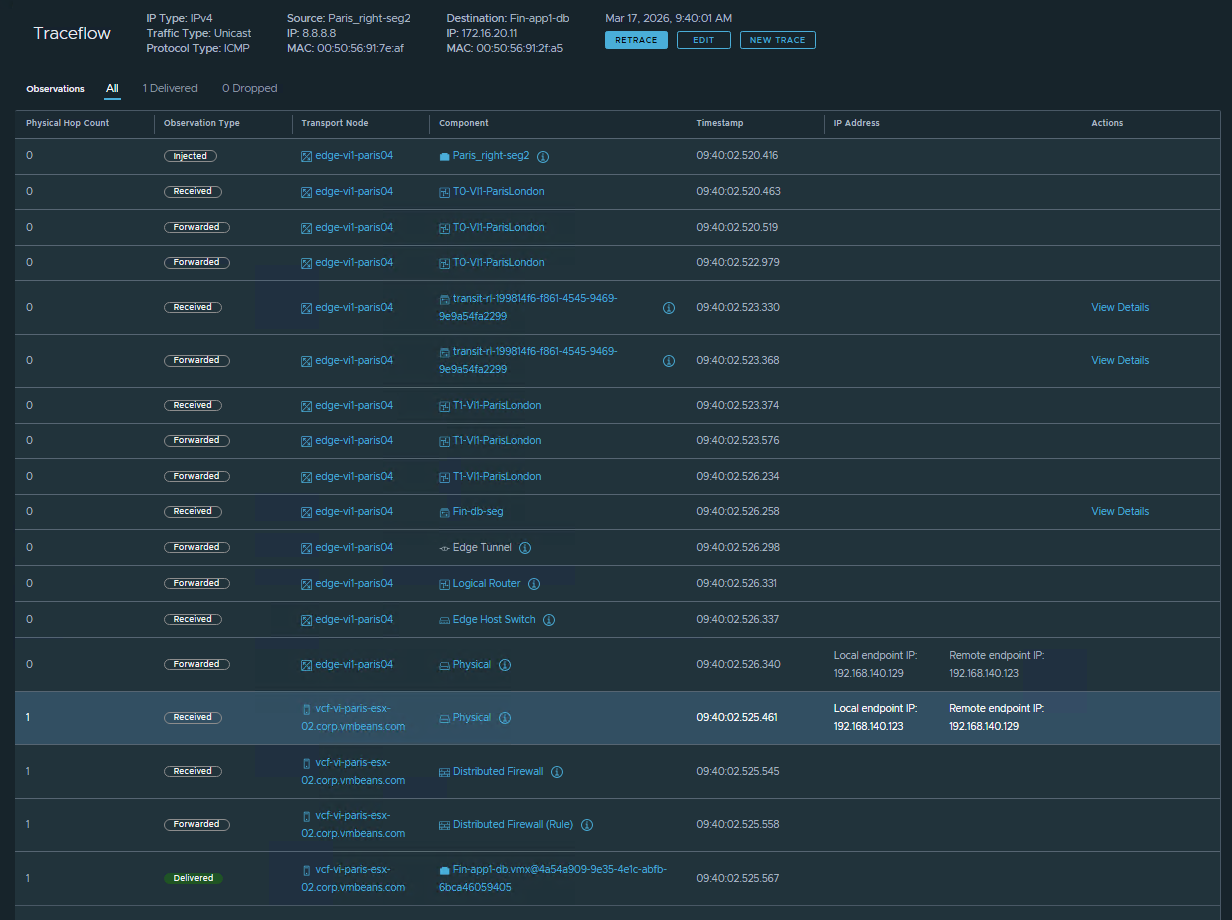
The resulting Traceflow output below provides an interesting look into the internals of the virtual networking stack. You get a hop-by-hop visualization as the packet ingresses the Tier-0, traverses the Tier-1 router, exits the Edge Node, and crosses the overlay to the destination ESXi host. Finally, you see it explicitly allowed by the DFW and successfully delivered to the VM’s vNIC.
The best part? You gather all of this definitive routing and forwarding data without requiring any packet captures, downtime, or coordination from the VM owner.
2. Identify the Firewall Rule Dropping Packets
Hunting down dropped packets in a micro-segmented environment can be tedious. Traditional troubleshooting involves accessing the host, tailing the dfwpktlogs, and grepping for IP addresses or drop actions.
- The Use Case: An application owner claims the virtual firewall is blocking their traffic, but you have hundreds of rules in your policy table and need to quickly verify if a FW rule is causing the issue.
- How it Works: When Traceflow injects a packet, it evaluates that packet against the actual state of the data plane. If the traffic hits a “Drop” or “Reject” rule in the Distributed Firewall (DFW) or a Gateway Firewall policy, the graphical path in the Traceflow topology map will terminate at the exact component where the block occurred. More importantly, in the observation table below the map, Traceflow logs the action as “Dropped” and outputs the exact Rule ID that caused the drop.
You don’t have to manually reverse-engineer which Security Groups or IP Sets a VM belongs to just to find the matching policy; you can take that exact Rule ID, find it in the UI, and correct the rule immediately.
FW Rule Identification Example and Output
Let’s look at a practical example. Suppose a Gateway Firewall rule is configured on a Tier-1 router to drop any outbound traffic sourced from IP address 10.9.9.11. When you run a Traceflow matching that source IP, the tool immediately flags the drop.
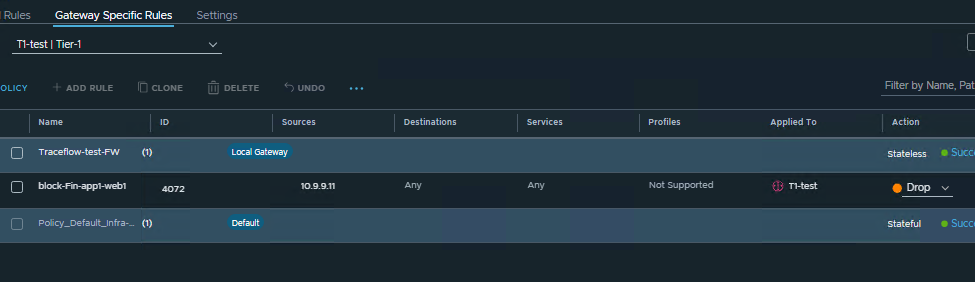
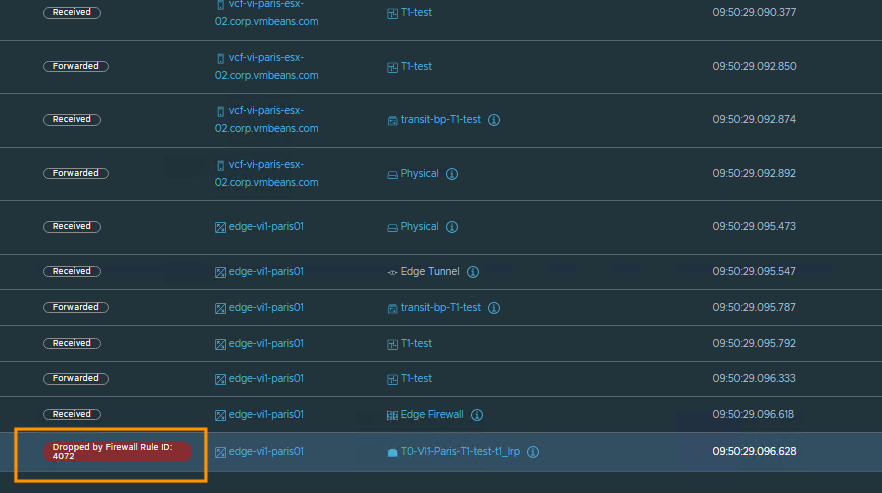
As shown in the observation table, Traceflow pinpoints where the packet was stopped (on the Tier-1 router) and provides the specific Rule ID that enforced the drop. This takes the guesswork out of policy troubleshooting.
3. Isolating the Fault Domain (Pinpointing the Physical Exit Point)
When troubleshooting North-South connectivity issues related to applications running in the virtual infrastructure, determining whether packet loss is occurring within the virtual overlay or the physical underlay is a standard part of the process. Quickly isolating the fault domain to either the virtual or physical network is critical for an efficient resolution.
- The Use Case: You need actionable data to determine if the virtual infrastructure is successfully routing this North-South traffic out of the environment and handing it off to the physical fabric.
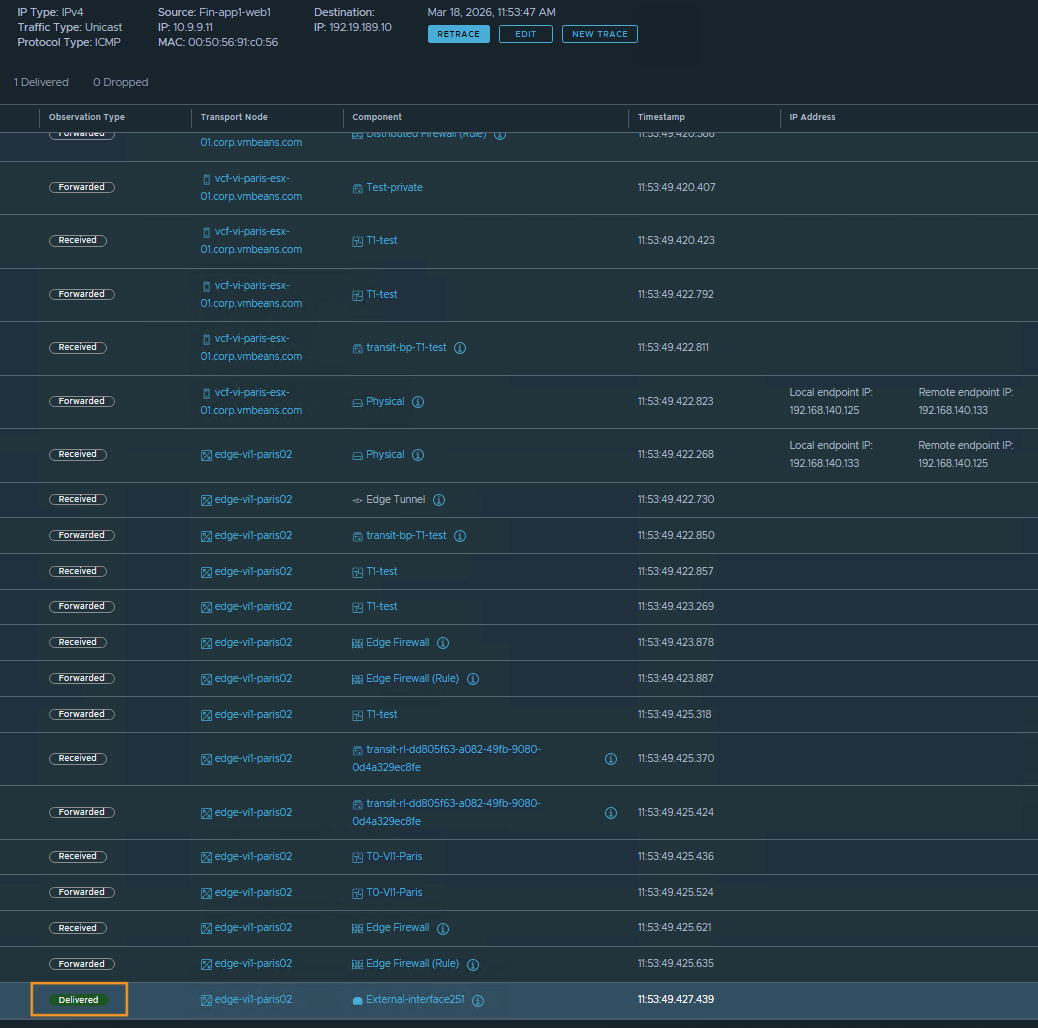
- How it Works: Traceflow bridges the logical and physical boundaries by tracking a synthetic packet down to the host tunnel endpoint (TEP) or Edge node TEP. In the observation table, it displays the packet’s traversal through the virtual network, identifies the uplink used to exit the environment, and explicitly logs when the packet is “Delivered” toward the physical network. If Traceflow indicates a successful handoff to the physical wire, it validates the virtual traffic path. While this is just one piece of the broader troubleshooting puzzle, it gives you a highly valuable data point to help collaborate with the physical network team.
Outbound Traceflow Example and Output
In the following example, we initiate a Traceflow from the same VM used in the previous firewall scenario, targeting an external IP address (192.19.189.10) on the physical network. The results show the packet exiting the Tier-0 (T0) router via the Edge uplink, resulting in a “Delivered” observation status. This status signifies that Traceflow observed the synthetic packet leaving the Edge node’s virtual network stack. While it does not guarantee the packet reached its final destination in the physical network, it confirms that the virtual infrastructure completed its routing and forwarding functions for the source and destination IP. Ultimately, this provides a solid data point suggesting that the troubleshooting focus should shift toward the physical network.
It is important to understand why this visibility ends at the physical boundary. Traceflow relies on components along the data path to observe the synthetic packet and report back to the management plane. Because external physical network devices do not currently process or report on these specific Traceflow packets, no further hop-by-hop telemetry is available once the traffic leaves the virtual infrastructure.
4. Finding the Exact NAT Translation In the Path
Network Address Translation (NAT) can be tricky to troubleshoot because the source or destination IP addresses change mid-flight. Traceflow is an invaluable tool for tracking NAT translation for a flow as it passes through Tier-0 or Tier-1 logical routers, specifically when services like Load Balancer Virtual IPs (VIPs) or Egress SNATs are actively modifying packet headers.
- The Use Case: Traffic is dropping halfway through a connection entering or leaving your environment, and you didn’t realize an overlapping SNAT or a misconfigured DNAT rule is translating the packet to an unexpected IP address.
- How it Works: In traditional network troubleshooting, verifying NAT rules often requires running simultaneous packet captures on multiple interfaces and manually correlating the before-and-after IP addresses. Traceflow eliminates this manual correlation by visualizing the entire virtual lifecycle of the packet in a single view.
As the synthetic packet traverses the logical routers, the observation table flags the exact hop where a Source NAT (SNAT) or Destination NAT (DNAT) occurs:
- Inbound Traffic (DNAT): If external traffic is hitting a public-facing NSX Load Balancer VIP, Traceflow will show exactly which internal backend IP the VIP was translated to, confirming if the inbound routing logic is correct.
- Outbound Traffic (SNAT): If internal workloads are reaching out to external networks, Traceflow reveals the exact translated source IP applied at the gateway. This is critical for proving to external firewall teams which IP address they need to allowlist.
Traceflow explicitly highlights the observation points where the NAT occurs, providing detailed information on both the applied NAT rule and the resulting translated IP address. This makes it a simple yet valuable method for proactively validating network forwarding logic before an application is even deployed.
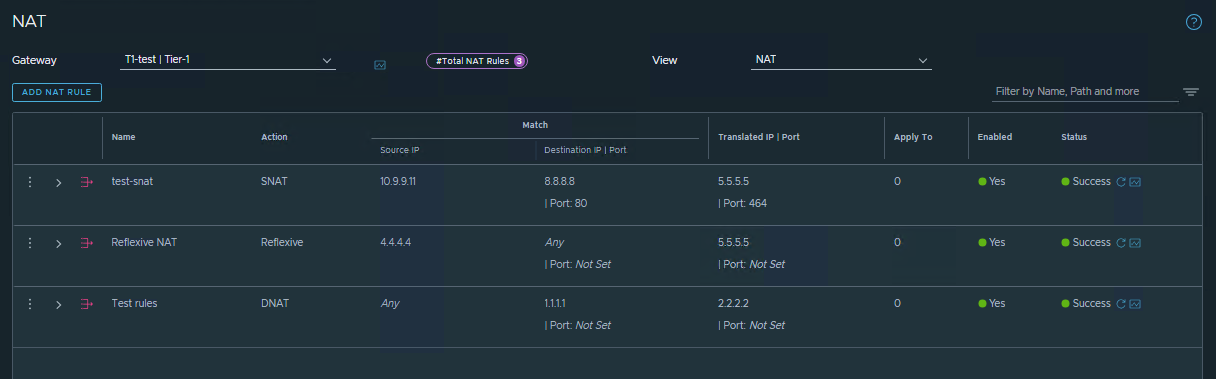
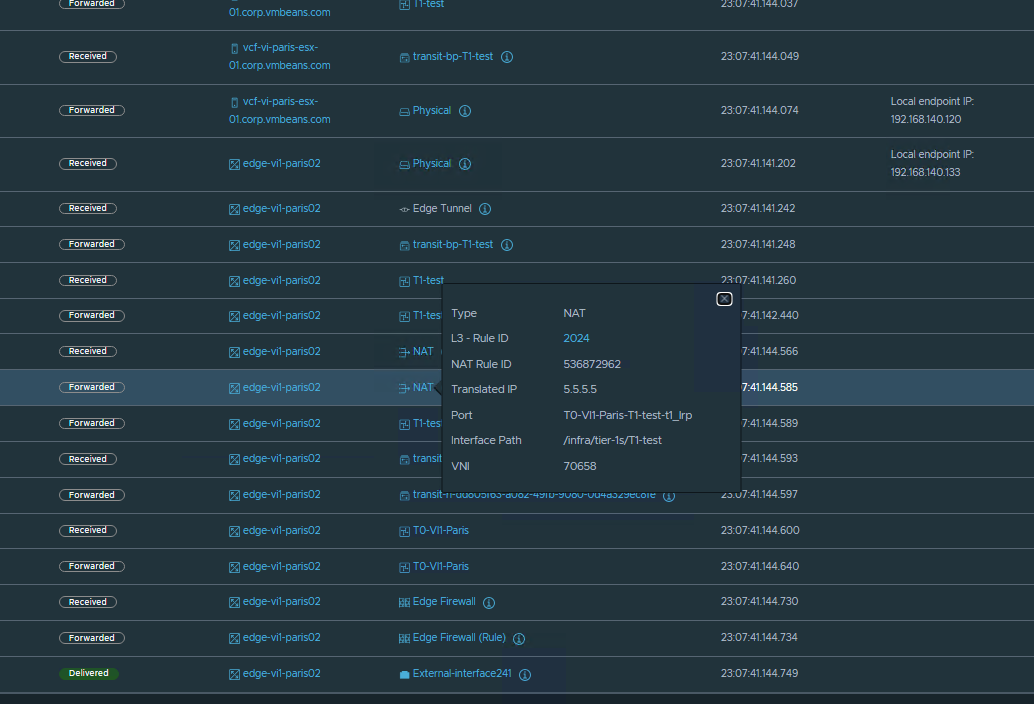
NAT Use Case Example and Output
In the following example, an SNAT rule is configured for traffic flows with a source IP of 10.9.9.11 and a destination of 8.8.8.8 on port 80. When a Traceflow is run matching this exact traffic pattern, the results show the SNAT operation occurring on the Tier-1 router, along with the newly translated IP address and the specific rule ID that was applied.
5. Automating Troubleshooting (Integrating Traceflow via API)
While Traceflow is highly visible and easy to use within the NSX Manager UI, it isn’t restricted to manual point-and-click operations. The entire Traceflow engine is exposed via the NSX REST API, which opens up powerful possibilities for programmatic troubleshooting at scale.
The Use Case: An application owner reports a connectivity drop. Instead of a Level 3 network engineer manually logging into the NSX Manager to investigate every single alert, you want to automate the initial triage process and empower Level 1 support.
How it Works: By integrating the Traceflow API with an IT Service Management (ITSM) platform (like ServiceNow) or a custom ChatOps bot (via Slack or Microsoft Teams), you can automate the data-gathering phase of troubleshooting.
When a user submits a ticket stating that “Web-VM-01 cannot reach DB-VM-01,” the ticketing system can automatically trigger a script (using Python, Postman, or PowerCLI) to execute a Traceflow API call between those specific virtual machines. NSX injects the synthetic packet, traces the path, and returns the JSON output.
The script parses this output and automatically appends the results directly to the ticket – instantly highlighting if the packet was successfully delivered, dropped by a specific Distributed Firewall (DFW) rule, or lost at a specific hop.
This provides several major benefits:
- Faster Mean Time to Resolution (MTTR): The network team has the exact drop point and rule ID waiting for them when they open the ticket.
- Self-Service Triage: Leveraging service accounts, it allows application owners or Level 1 helpdesk staff to safely validate network paths without requiring administrative access to the NSX UI.
- Bulk Validation: After a large-scale data center migration or a complex DFW rule change, scripts can programmatically run hundreds of Traceflows between application tiers to rapidly verify that the new topology is routing correctly.
For exact endpoints, JSON payloads, and parameter requirements to build these automated workflows, refer to the official NSX-T Data Center REST API Guide on the Broadcom Developer Portal.
Final Thoughts
Traceflow is far more than a basic ping test – it provides critical visibility and actionable data points for understanding your virtual network. Whether you are validating complex NAT rules, bridging the gap with physical network teams, or automating helpdesk triage via the REST API, it significantly cuts through the noise of network troubleshooting.When the next connectivity ticket arrives, consider starting with Traceflow before deploying simultaneous packet captures. By visualizing the entire virtual lifecycle of a packet in a single view, Traceflow eliminates the need for manual correlation, making it a highly effective first step to quickly isolate the fault domain and reduce your Mean Time to Resolution (MTTR). If your troubleshooting then requires analyzing historical traffic patterns and active IPFIX flows – the Path Topology feature in VCF Operations for Networks also can serves as a powerful complementary tool for deep end-to-end visibility. Equipping your team with these built-in tools transforms network troubleshooting from a frustrating guessing game into a streamlined, data-driven process.
Discover more from VMware Cloud Foundation (VCF) Blog
Subscribe to get the latest posts sent to your email.


