

The monitoring and analysis of a complex data center can be much easier with the right tools. The right tool for VMware Cloud Foundation (VCF) is VCF Operations. It gathers the extraordinary amount of metrics generated within the environment, and distills it down into meaningful and actionable information for your optimization, troubleshooting, and planning efforts. And with VCF, it is software you already own courtesy of your VCF license.
VCF Operations in VCF 9.0 takes a great step forward with environments powered by vSAN. Since vSAN is built into the hypervisor, the insights that VCF Operations can offer are truly unique. Let’s look at why this is, and how its ability to monitor vSAN storage has been improved in VCF 9.0
The Difference with vSAN Powered VCF Environments
Environments built on a traditional three-tier architecture using a storage array struggle to provide accurate insight into the storage-related aspects of their environment, as they relate to the VMs. The storage array is detached from the hypervisor. In this architecture, all visibility and control of I/O is lost the moment the I/O leaves the HBAs of the host. Unfortunately this cannot be mitigated by monitoring capabilities of a storage array. This is because storage related metrics are measured by the array vendor in different ways and at different locations. What you measure, how you measure it, and where you measure it are critically important to taking the correct steps to optimize or troubleshoot an environment.
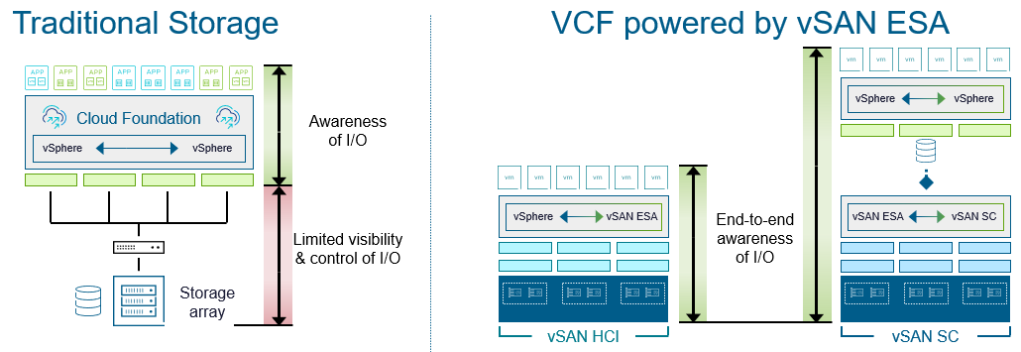
Figure. Comparing visibility and control of I/O with traditional storage versus vSAN.
vSAN in a VCF environment is different. vSAN is a part of the hypervisor. Using its own scheduler, I/O is visible and managed from end to end, regardless if it is deployed as an aggregated vSAN HCI cluster, or disaggregated using vSAN storage clusters. This awareness and control is what has always given vSAN unique abilities to provide unique metrics about the behavior of I/O. APIs make this data readily available in VCF Operations.
VCF Operations – A Better Way to View Your Infrastructure
If vCenter Server contains a wealth of vSAN metrics, then why do I need VCF Operations? VCF operates at the appropriate stratum of visibility. Whereas vCenter Server provides tremendous information at the cluster and host levels, VCF Operations excels at looking at the data center holistically. Consider a modern vehicle that has a Tire Pressure Management Systems (TPMS) that helps you detect issues with your tires. These sensors monitor each discrete tire, but present them to you all at once, as they have an equal importance in the operation of your vehicle. Think of VCF Operations as serving the same purpose – giving you insight with the appropriate context within your virtual private cloud.
For VCF Operations in 9.0, new views and dashboards help take the mystery of storage monitoring and analysis in your VCF environment.
Storage Operations Viewing Capabilities
Under the “Infrastructure Operations” section on the left side of the VCF Operations UI, the new “Storage Operations” view is intended to be an operational overview page for all types of storage powering your VCF environment. This gives you the flexibility of not only seeing all of your vSAN storage across your VCF instance, but other storage resources providing VMFS or NFS datastores.

Figure. Viewing different storage types in the VCF Storage Operations View
The widget found in the upper left hand corner of the dashboard provides a summation of storage alerts, and a timeline of changes. This is particularly helpful to identify if there have been any significant issues triggers over the past week, and the relative change.
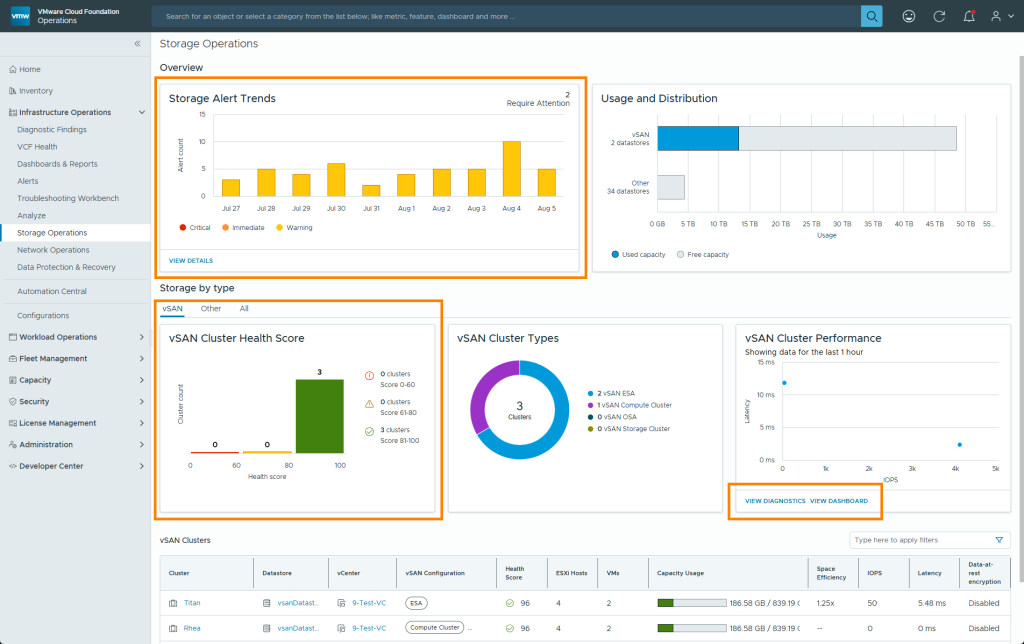
Figure. VCF Storage Operations View
When viewing vSAN-related storage resource, all of cluster health scores, which are a part of the Skyline Health Scoring, Diagnostics and Remediation capability, are assembled in a single location. It will place each cluster’s score within one of three categories: 81-100 (green), which means the cluster is generally healthy with no immediate attention required. 61-80 (yellow), indicating that health has been degraded, and attention is suggested, and finally, 0-60 (red) means the cluster is unhealthy, and immediate attention is required. This bar chart will allow you to monitor your environment at scale, easily checking the health and well-being of your vSAN clusters across your entire VCF instance.
With several clickable links, the view also serves as a launching point for other insights, such as cluster-specific analysis. However, two of the links: “View Dashboard” and “View Diagnostics” lead to other areas in VCF Operations that assist with vSAN administration across your entire VCF instance.
Performance Viewing Capabilities
Within the Storage Operations View, clicking on the “View Dashboard” leads you to a dashboard focused on analyzing vSAN performance across multiple clusters. This gives you the unique ability to quickly access and view time-based performance metrics for your various clusters. Simply highlight the cluster, and see the metrics.
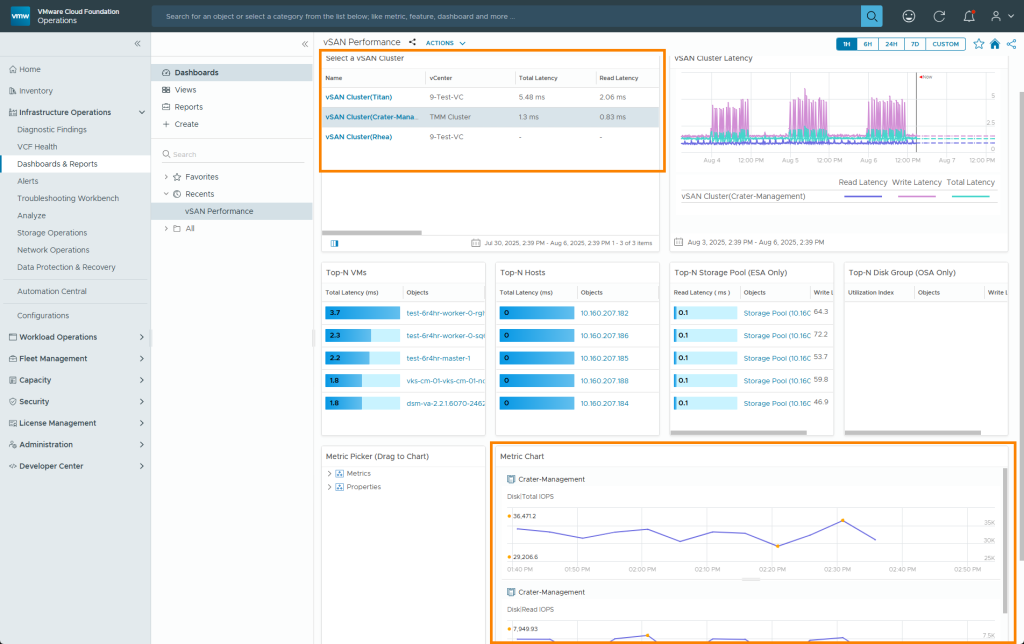
Figure. Performance viewing in VCF Operations.
Recommendation. Click just to the right of the vSAN cluster name to take advantage of this dashboard’s ability to show relative metrics between vSAN clusters. Clicking directly on the vSAN cluster name will take you to the cluster specific dashboard that offers more extensive detail about the cluster, but is not ideal for performing comparisons between vSAN clusters.
One of the unique features of this dashboard is the “Metrics Picker.” This allows you to drag and drop the desired metrics you’d like into the “Metrics Chart” area. Those selected metrics will be shown in a time-based format for any cluster selected. This makes customization easy, and effective.
Diagnostics
Within the Storage Operations View, clicking on “View Diagnostics” leads you to a vSAN Performance Diagnostics page. This allows you to produce a sanity check for your vSAN ESA clusters, where you can select one of two diagnostics goals: Troubleshooting, which is intended for a production cluster, or Benchmarking, which is geared for new clusters prior to moving into production.
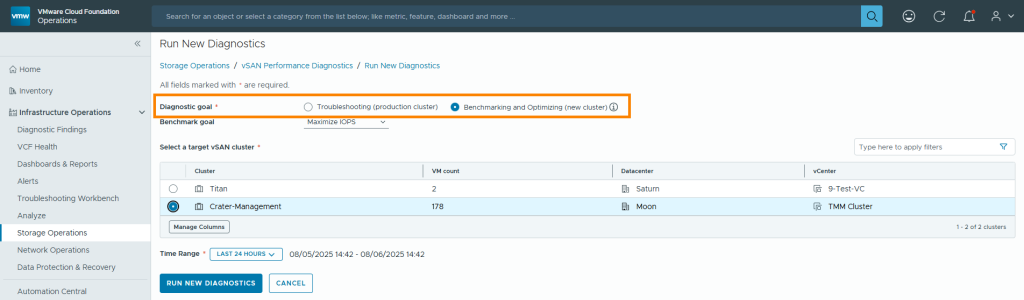
Figure. vSAN performance diagnostics > Run Diagnostics page.
The output will depend on the diagnostics goal selected, and characteristics of the cluster. In both cases, it will alert you if it detects any issues and provide guidance on how to remedy those findings. Otherwise, it will indicate that no issues have been detected.
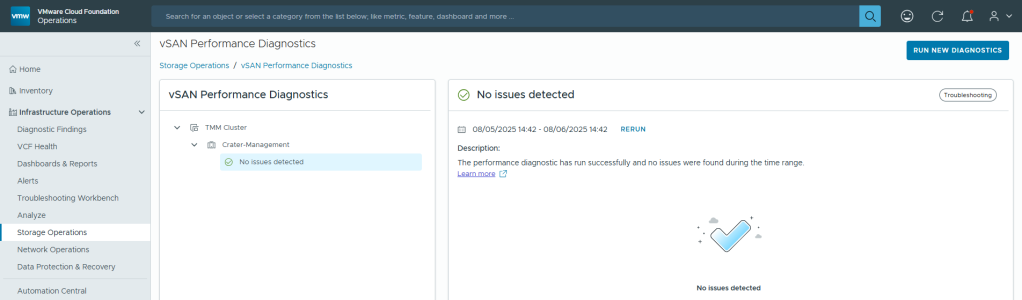
Figure. vSAN performance diagnostics output.
Recommendation. Include the diagnostics test for new clusters introduced into production. This can help detect any previously unidentified issues prior to running production workloads on a cluster.
VCF Operations for Logs Integration
When administering a VCF environment powered by vSAN, we can’t overlook the insight gained from log analysis. The “Infrastructure Operations” > “Analyze” presents a basic view of log data captured by VCF Operations for Logs. This view within VCF Operations represents a basic integration between the two tools. A full collection of comprehensive dashboards with predefined filtering for vSAN can be found connecting the the appliance providing VCF Operations for Logs
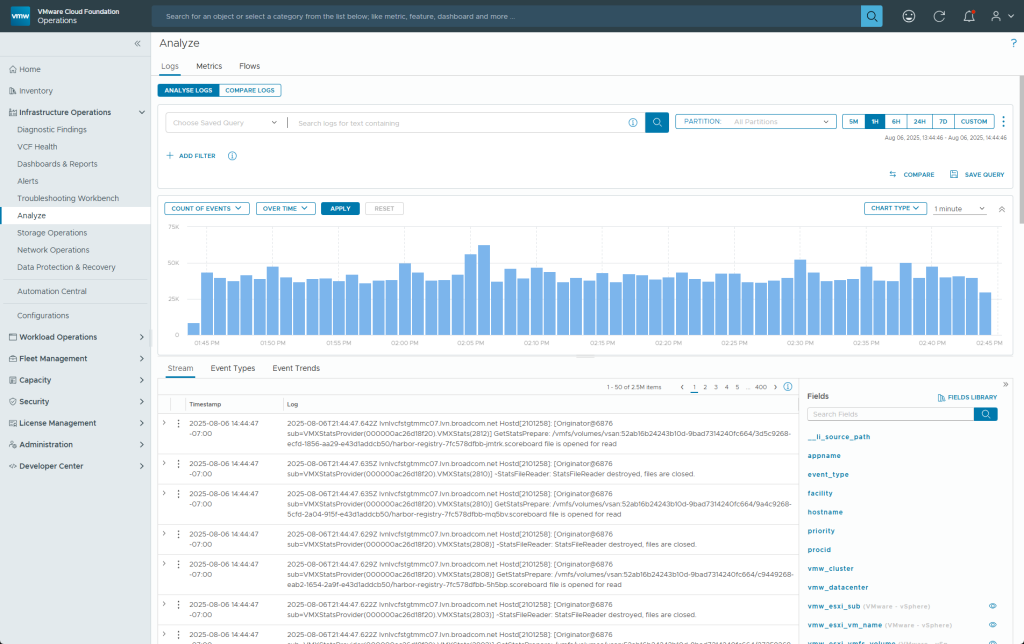
Figure. vSAN Operations for Logs integration.
Using log analysis with vSAN powered environments can be incredibly valuable. For example, errors with a network card that can have an impact on vSAN communication and object health can easily be identified using VCF Operations for Logs. It can be tremendously helpful in correlating non-vSAN related log events with vSAN-based log events.
Summary
Since vSAN is a part of the hypervisor, VCF is able to exploit this ability to measure the right data, in the right way, from the right location. The result is information that you can trust, and insight that you can help your ongoing operations and future planning.
Discover more from VMware Cloud Foundation (VCF) Blog
Subscribe to get the latest posts sent to your email.


