Monitoring and troubleshooting virtual machine (VM) performance inevitably leads to a desire to compare the performance characteristics between two or more VMs. This typically means that the administrator must navigate back and forth between multiple locations in the User Interface (UI) of vCenter Server. While this practice is effective, it is not as efficient as it could be.
vSAN 7 U1 introduces a new consolidated view in the vCenter Server UI that allows for easy comparison of performance data of two or more VMs, all in a single location. This simple, intuitive enhancement will go a long way in improving monitoring and troubleshooting efforts. Let’s look at this feature in more detail, and how it can be used.
What problems does it solve?
Time-based performance metrics have the potential to provide tremendous insight into an environment, but their usefulness depends heavily on how they are used. Using them correctly can improve the accuracy of the question you might be attempting to answer, such as, “Why did a VM’s performance degrade over a certain window of time?”
The new consolidated performance view for VMs serves two distinct purposes.
- VM Comparison. How do the performance metrics of one VM compare to a select set of other VMs? Often, performance metrics will auto-scale on the Y-axis to make the best use of the screen real estate. When comparing perhaps the throughput with multiple VMs, our eyes fixate on the placement of the line across the time-based graph, and it is easy to overlook that the Y-axis scale may show a maximum of 500KBps, while the other shows 500MBps. A consolidated view would use the same Y-axis, which simplifies the comparison.
- VM Correlation. Is the workload of one VM impacting the behavior of another VM? A latency spike experienced by a VM could be a result of a change in the workload characteristics (e.g. demand from the application), or it can be a byproduct of a change in demand from other workloads. This is one of the most critical determinations to make when troubleshooting the performance of a VM but is difficult to determine when the views are rendered separately.
As shown in Figure 1, cluster-level metrics provide an aggregate sum of performance data such as IOPS and throughput, while providing an average for latency. While viewing elements at the cluster level is an important step in the troubleshooting process, it doesn’t allow you to understand the primary contributors to the area of interest.
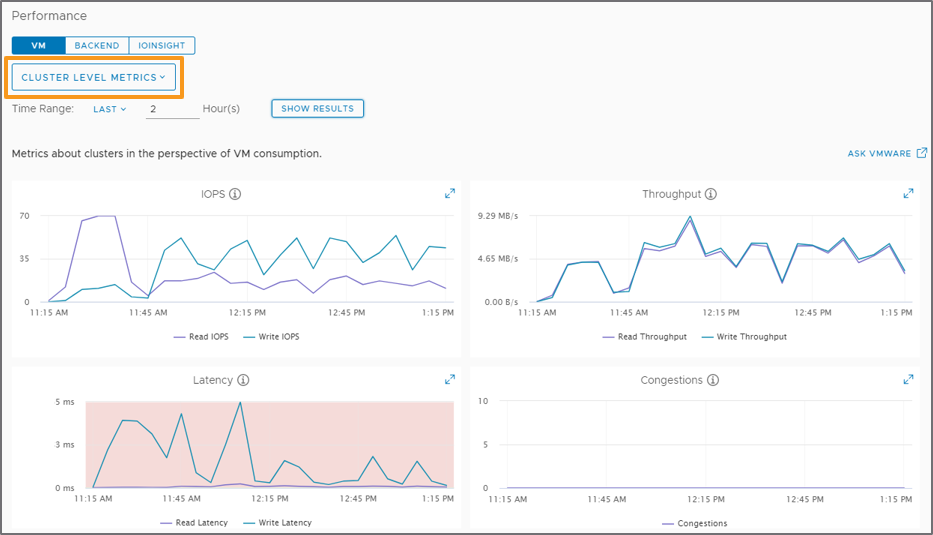
Figure 1. Aggregate Cluster view showing sums for IOPS and Throughput
The new “Show Specific VMs” view
Available at the cluster level under Monitor > vSAN > Performance with the “VM” tab highlighted, there will be an option to show the aggregate “Cluster level metrics” (default), or “Show specific VMs.” By selecting the latter, it will present a list of VMs in the cluster. Simply choose the VMs that you wish to see, as shown in Figure 2.
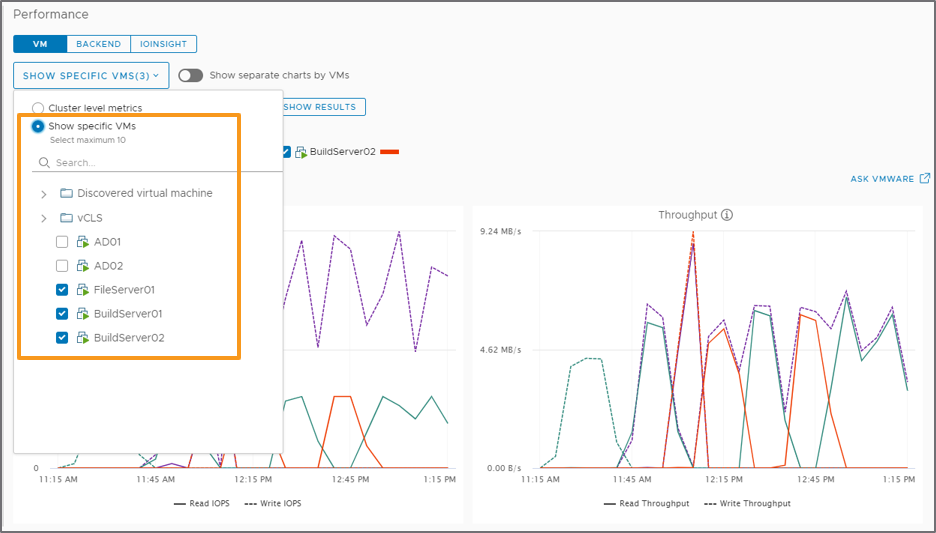
Figure 2. Selecting specific VMs to view in an overlapped view
Performance metrics of the selected VMs will be displayed in a simple, overlapping manner, as shown in Figure 3. The metrics available for VM comparisons include IOPS, throughput, latency, congestions, and outstanding I/O. If you are uncertain as to what these metrics represent, a summary of the most common performance metrics in vSAN can be found in Appendix A of the Troubleshooting vSAN Performance on https://core.vmware.com
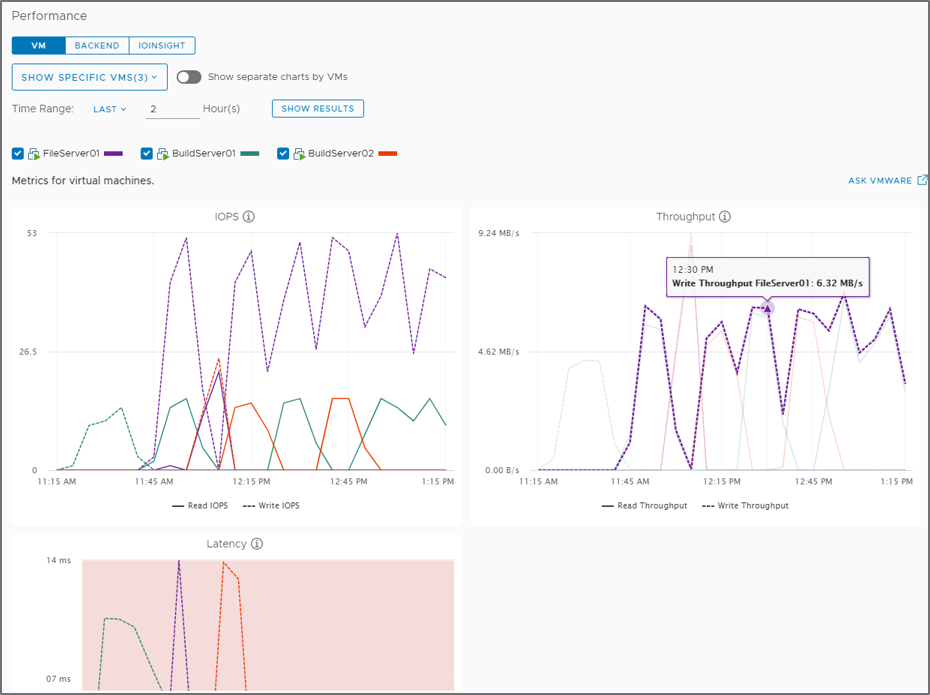
Figure 3. Viewing the metrics of multiple VMs
The metrics for one VM can be easily toggled off and on for a clear understanding of each VM, as shown in Figure 4. The visibility of reads and writes can also be toggled off or on depending on your need. To minimize the clutter, the view will be rendered in multiple pages when more than 15 VMs are selected at a time.
Recommendation: Keep the number of selected or highlighted VMs modest until you begin to feel more comfortable comparing and contrasting the performance metrics of multiple VMs. Simplifying the view can reduce distractions.
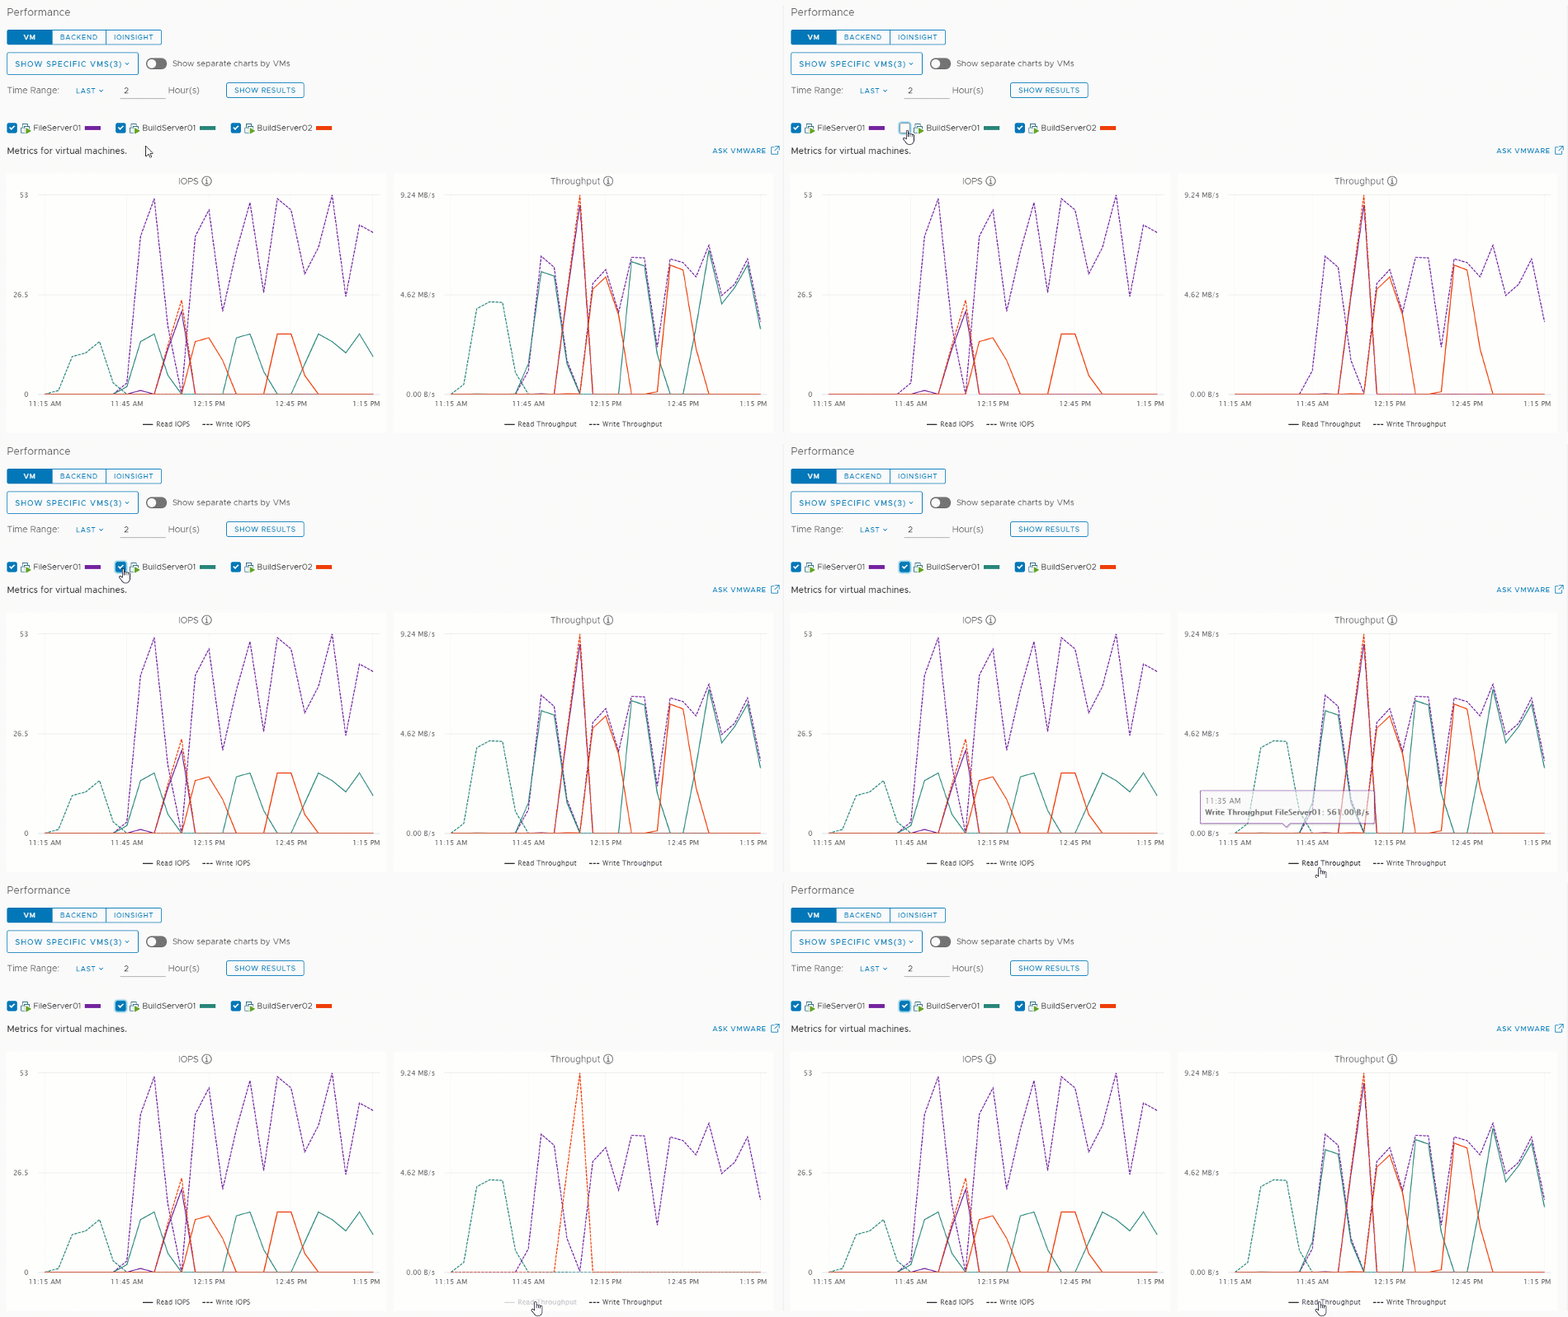
Figure 4. Toggling on or off the VMs selected for this view
The view also provides the user the flexibility to view the same metrics, split into separate charts for each VM, as shown in Figure 5.
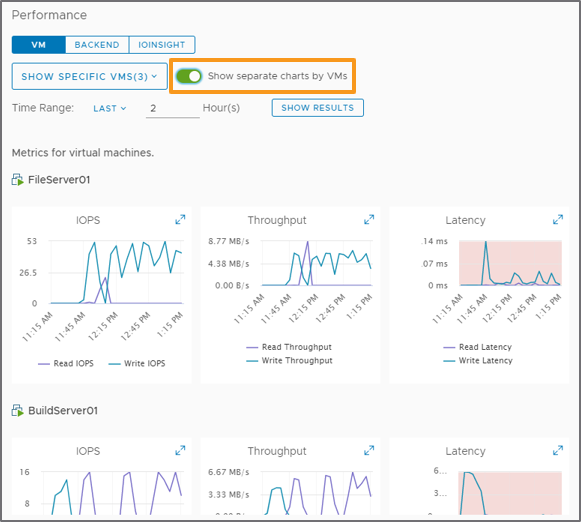
Figure 5. Using the “Show separate charts by VMs” view
The other aspects of the view remain the same, such as the ability to change the time window viewed. See “Changing Time Windows for Better Insight with Performance Metrics with vSAN and vSphere” for more information. The feature can also be used in conjunction with the new IO Insight feature embedded into vSAN 7 U1. Stay tuned for more information the capability this new feature introduces.
Putting the new views to work
Imagine a scenario in which users are reporting poor response times from an application. After looking at the performance of the VM and confirming that latency appears high over a period of time, these new views could be used for a quick comparison of latency with other systems over the same period of time to better understand what might be expected from the given environment. The administrator will be able to also determine if there is a correlation of the higher latency with other VMs: One of the best ways to narrow down the potential cause of the change in latency.
Summary
Understanding performance metrics and the concepts of troubleshooting performance can be a challenge for many administrators. VMware is committed to making this aspect of managing a virtual environment easier through improved tools that are easy to use and built right into the software you already know. The new consolidated VM performance views in vSAN 7 U1 is a great example of how VMware is making vSAN and you more efficient than ever.
Discover more from VMware Cloud Foundation (VCF) Blog
Subscribe to get the latest posts sent to your email.


