vSphere 6.5 brings a number of enhancements to ESXi host lifecycle management as well as some new capabilities to our venerable resource management features, DRS and HA. There are also greatly enhanced developer and automation interfaces, which are a major focus in this release. Last but not least, there are some notable improvements to vRealize Operations, since this product is bundled with certain editions of vSphere. Let’s dig into each of these areas.
Enhanced vSphere Host Lifecycle Management Capabilities
With vSphere 6.5, administrators will find significantly easier and more powerful capabilities for patching, upgrading, and managing the configuration of VMware ESXi hosts.
VMware Update Manager (VUM) continues to be the preferred approach for keeping ESXi hosts up to date, and with vSphere 6.5 it has been fully integrated with the VCSA. This eliminates the additional VM, operating system license, and database dependencies of the previous architecture, and now benefits from the resiliency of vCenter HA for redundancy. VUM is enabled by default and ready to handle patching and upgrading tasks of all magnitudes in your datacenter.
Host Profiles has come a long way since the initial introduction way back in vSphere 4! This release offers much in the way of both management of the profiles, as well as day-to-day operations. For starters, an updated graphical editor that is part of the vSphere Web Client now has an easy-to-use search function in addition to a new ability to mark individual configuration elements as favorites for quick access.
 Administrators now have the means to create a hierarchy of host profiles by taking advantage of the new ability to copy settings from one profile to one or many others.
Although Host Profiles provides a means of abstracting management away from individual hosts in favor of clusters, each host may still have distinct characteristics, such as a static IP address, that must be accommodated. The process of setting these per-host values is known as host customization, and with this release it is now possible to manage these settings for groups of hosts via CSV file – undoubtedly appealing to customers with larger environments.
Compliance checks are more informative as well, with a detailed side-by-side comparison of values from a profile versus the actual values on a host. And finally, the process of effecting configuration change is greatly enhanced in vSphere 6.5 thanks to DRS integration for scenarios that require maintenance mode, and speedy parallel remediation for changes that do not.
Auto Deploy – the boot-from-network deployment option for vSphere – is now easier to manage in vSphere 6.5 with the introduction of a full-featured graphical interface. Administrators no longer need to use PowerCLI to create and manage deploy rules or custom ESXi images.

New and unassigned hosts that boot from Auto Deploy will now be collected under the Discovered Hosts tab as they wait patiently for instructions, and a new interactive workflow enables provisioning without ever creating a deploy rule.
Custom integrations and other special configuration tasks are now possible with the Script Bundle feature, enabling arbitrary scripts to be run on the ESXi hosts after they boot via Auto Deploy.
Scalability has been greatly improved over previous releases and it’s easy to design an architecture with optional reverse proxy caches for very large environments needing to optimize and reduce resource utilization on the VCSA. And like VUM, Auto Deploy also benefits from native vCenter HA for quick failover in the event of an outage.
In addition to all of that, we are pleased to announce that Auto Deploy now supports UEFI hardware for those customers running the newest servers from VMware OEM partners.
It’s easy to see how vSphere 6.5 makes management of hosts easier for datacenters of all sizes!
Resource Management – HA, FT and DRS
vSphere continues to provide the best availability and resource management features for today’s most demanding applications. vSphere 6.5 continues to move the needle by adding major new features and improving existing features to make vSphere the most trusted virtual computing platform available. Here is a glimpse of the what you can expect to see when vSphere 6.5 later this year.
Proactive HA
Proactive HA will detect hardware conditions of a host and allow you to evacuate the VMs before the issue causes an outage. Working in conjunction with participating hardware vendors, vCenter will plug into the hardware monitoring solution to receive the health status of the monitored components such as fans, memory, and power supplies. vSphere can then be configured to respond according to the failure.
Once a component is labeled unhealthy by the hardware monitoring system, vSphere will classify the host as either moderately or severely degraded depending on which component failed. vSphere will place that affected host into a new state called Quarantine Mode. In this mode, DRS will not use the host for placement decisions for new VMs unless a DRS rule could not otherwise be satisfied. Additionally, DRS will attempt to evacuate the host as long as it would not cause a performance issue. Proactive HA can also be configured to place degraded hosts into Maintenance Mode which will perform a standard virtual machine evacuation.
vSphere HA Orchestrated Restart
vSphere 6.5 now allows creating dependency chains using VM-to-VM rules. These dependency rules are enforced if when vSphere HA is used to restart VMs from failed hosts. This is great for multi-tier applications that do not recover successfully unless they are restarted in a particular order. A common example to this is a database, app, and web server.
In the example below, VM4 and VM5 restart at the same time because their dependency rules are satisfied. VM7 will wait for VM5 because there is a rule between VM5 and VM7. Explicit rules must be created that define the dependency chain. If that last rule were omitted, VM7 would restart with VM5 because the rule with VM6 is already satisfied.

In addition to the VM dependency rules, vSphere 6.5 adds two additional restart priority levels named Highest and Lowest providing five total. This provides even greater control when planning the recovery of virtual machines managed by vSphere HA.
Simplified vSphere HA Admission Control
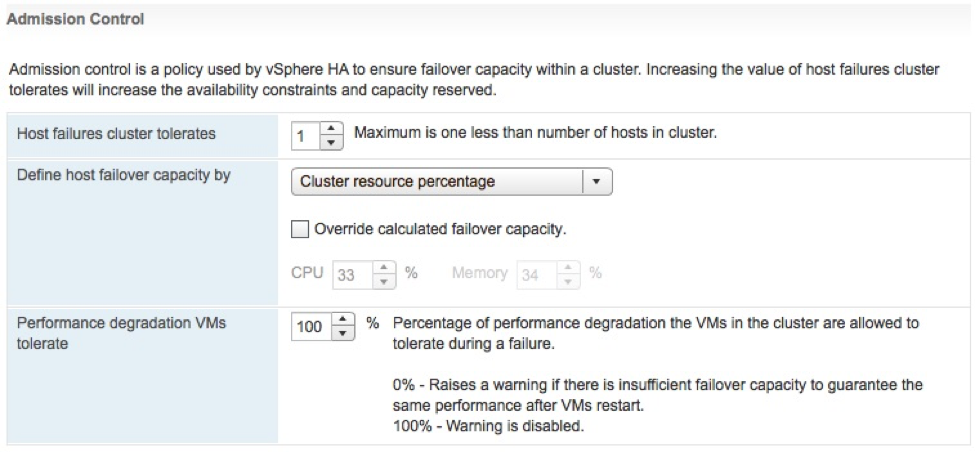
Several improvements have been made to vSphere HA Admission Control. Admission control is used to set aside a calculated amount of resources that are used in the event of a host failure. One of three different policies are used to enforce the amount of capacity is set aside. Starting with vSphere 6.5, this configuration just got simpler. The first major change is that the administrator simply needs to define the number of host failures to tolerate (FTT). Once the numbers of hosts are configured, vSphere HA will automatically calculate a percentage of resources to set aside by applying the “Percentage of Cluster Resources” admission control policy. As hosts are added or removed from the cluster, the percentage will be automatically recalculated. This is the new default configuration, but it is possible to override the automatic calculation or use another admission control policy.
Additionally, the vSphere Web Client will issue a warning if vSphere HA detects a host failure would cause a reduction in VM performance based on the actual resource consumption, not only based on the configured reservations. The administrator is able to configure how much of a performance loss is tolerated before a warning is issued.
 Fault Tolerance (FT)
vSphere 6.5 FT has more integration with DRS which will help make better placement decisions by ranking the hosts based on the available network bandwidth as well as recommending which datastore to place the secondary vmdk files.
There has been a tremendous amount of effort to lower the network latency introduced with the new technology that powers vSphere FT. This will improve the performance to impact to certain types of applications that were sensitive to the additional latency first introduced with vSphere 6.0. This now opens the door for even a wider array of mission critical applications.
FT networks can now be configured to use multiple NICs to increase the overall bandwidth available for FT logging traffic. This is a similar configuration to Multi-NIC vMotion to provide additional channels of communication for environments that required more bandwidth than a single NIC can provide.
DRS Advanced Options
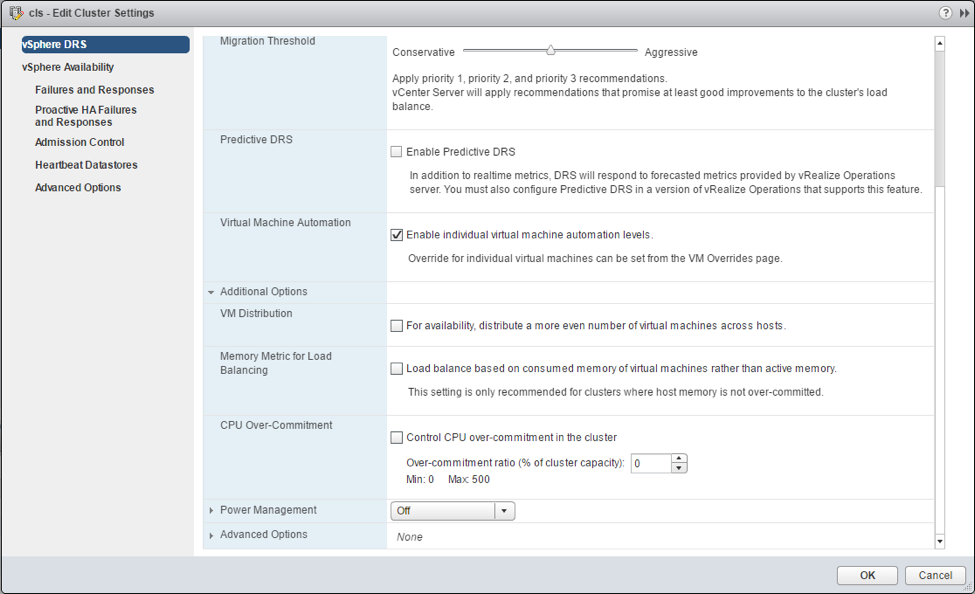
Three of the most common advanced options used in DRS clusters are now getting their own checkbox in the UI for simpler configuration.
- VM Distribution: Enforce an even distribution of VMs. This will cause DRS to spread the count of the VMs evenly across the hosts. This is to prevent too many eggs in one basket and minimizes the impact to the environment after encountering a host failure. If DRS detects a severe imbalance to the performance, it will correct the performance issue at the expense of the count being evenly distributed.
- Memory Metric for Load Balancing: DRS uses Active memory + 25% as its primary metric when calculating memory load on a host. The Consumed memory vs active memory will cause DRS to use the consumed memory metric rather than Active. This is beneficial when memory is not over-allocated. As a side effect, the UI show the hosts be more balanced.
- CPU over-commitment: This is an option to enforce a maximum vCPU:pCPU ratios in the cluster. Once the cluster reaches this defined value, no additional VMs will be allowed to power on.
 Network-Aware DRS
DRS now considers network utilization, in addition to the 25+ metrics already used when making migration recommendations. DRS observes the Tx and Rx rates of the connected physical uplinks and avoids placing VMs on hosts that are greater than 80% utilized. DRS will not reactively balance the hosts solely based on network utilization, rather, it will use network utilization as an additional check to determine whether the currently selected host is suitable for the VM. This additional input will improve DRS placement decisions, which results in better VM performance.
SIOC + SPBM
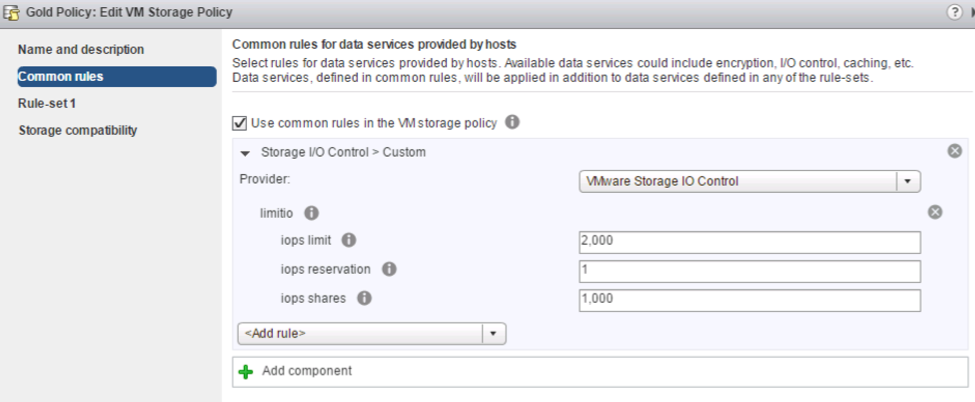
Storage IO Control configuration is now performed using Storage Policies and IO limits enforced using vSphere APIs for IO Filtering (VAIO). Using the Storage Based Policy Management (SPBM) framework, administrators can define different policies with different IO limits, and then assign VMs to those policies. This simplifies the ability to offer varying tiers of storage services and provides the ability to validate policy compliance.
 Content Library
Content Library with vSphere 6.5 includes some very welcome usability improvements. Administrators can now mount an ISO directly from the Content Library, apply a Guest OS Customization during VM deployment, and update existing templates.
Performance and recoverability has also been improved. Scalability has been increased, and there is new option to control how a published library will store and sync content. When enabled, it will reduce the sync time between vCenter Servers are not using Enhanced Linked Mode.
The Content Library is now part of the vSphere 6.5 backup/restore service, and it is part of the VC HA feature set.
Developer and Automation Interfaces
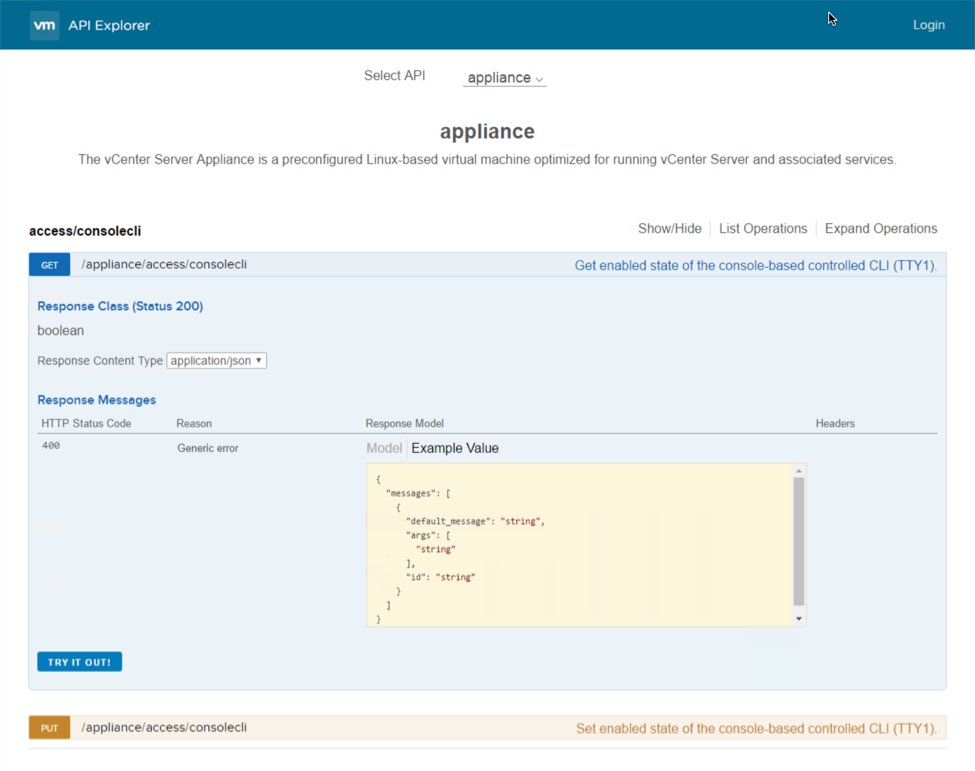
The vSphere developer and automation interfaces are receiving some fantastic updates as well. Starting with the vSphere’s REST APIs, these have been extended to include VCSA and VM based management and configuration tasks. There’s also a new way to explore the available vSphere REST APIs with the API Explorer. The API Explorer is available locally on the vCenter server itself and will include information like what URL the API task is available to be called by, what method to use, what the request body should look like, and even a “Try It Out” button to perform the call live.
 Moving over to the CLIs, PowerCLI is now 100% module based! There’s also some key improvements to some of those modules as well. The Core module now supports cross vCenter vMotion by way of the Move-VM cmdlet. The VSAN module has been bolstered to feature 13 different cmdlets which focus on trying to automate the entire lifecycle of VSAN. The Horizon View module has been completely re-written and allows users to perform View related tasks from any system as well as the ability to interact with the View API.
The vSphere CLI (vCLI) also received some big updates. ESXCLI, which is installed as part of vCLI, now features several new storage based commands for handling VSAN core dump procedures, utilizing VSAN’s iSCSI functionality, managing NVMe devices, and other core storage commands. There’s also some additions on the network side to handle NIC based commands such as queuing, coalescing, and basic FCOE tasks. Lastly, the Datacenter CLI (DCLI), which is also installed as part of vCLI, can make use of all the new vSphere REST APIs!
Check out this example of the power of DCLI’s interactive mode with features like tab complete:

Operations Management
There’s been some exciting improvements on the vSphere with Operations Management (vSOM) side of the house as well. vRealize Operations Manager (vR Ops) has been updated to version 6.4 which include many new dashboards, dashboard improvements, and other key features to help administrators get to the root cause that much faster and more efficient. Log Insight for vCenter has been also updated, and will be on version 4.0. It contains a new user interface (UI) based on our new Clarity UI, increased API functionality around the installation process, the ability to perform automatic updates to agents, and some other general UI improvements. Also, both of these products will be compatible with vSphere 6.5 on day one.
Digging a little further into the vR Ops improvements, let’s first take a look at the three new dashboards titled: Operations Overview, Capacity Overview, and Troubleshoot a VM. The Operations dashboard will display pertinent environment based information such as an inventory summary, cluster update, overall alert volume, and some widgets containing Top-15 VMs experiencing CPU contention, memory contention, and disk latency. The Capacity dashboard contains information such as capacity totals as well as capacity in use across CPU count, RAM, and storage, reclaimable capacity, and a distributed utilization visualization. The Troubleshoot a VM dashboard is a nice central location to view individual VM based information like its alerts, relationships, and metrics based on demand, contention, parent cluster contention, and parent datastore latency.

One other improvement that isn’t a dashboard but is a new view for each object, is the new resource details page. It closely resembles the Home dashboard that was added in a prior version, but only focuses on the object selected. Some of the information displayed is any active alerts, key properties, KPI metrics, and relational based information.
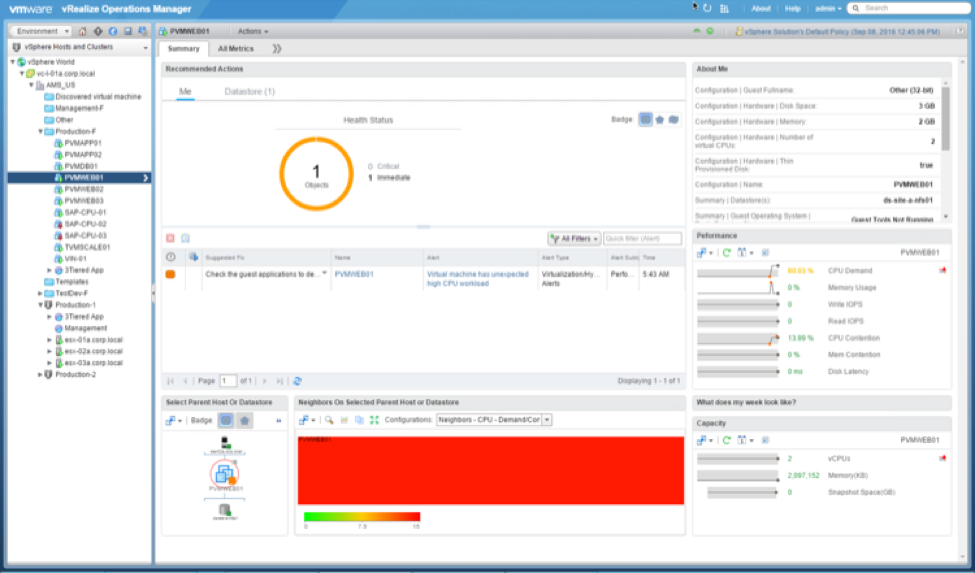
Covering some of the other notable improvements, there is now the ability to display the vSphere VM folders within vR Ops. There’s also the ability to group alerts so that it’s easy to see what the most prevalent alert might be. Alert groups also enable the functionality to clear alerts in a bulk fashion. Lastly, there are now KPI metric groups available out of the box to help easily chart out and correlate properties with a single click.


