This article describes some performance tests we conducted to explore the advantages of virtualizing NVIDIA GPUs with VMware vSphere for generative AI workloads. We tested LLAMA2-7b and LLAMA2-13b parameter models using various virtual GPU (vGPU) and multi-instance GPU (MIG) configurations on vSphere 8.0 U3 with NVIDIA vGPU driver v17.
Performance results with 2 virtual machines (VMs) sharing a single physical GPU using virtualization show much higher aggregate throughput compared to 1 giant VM on 1 physical GPU of the same overall capacity. The aggregate throughput with 3 VMs sharing a single GPU is even higher than that of 2 VMs sharing a GPU. The single VM results show that the throughput increases linearly as the size of the MIG compute slice increases.
In the following sections, we have summarized some of our important findings from a subset of overall tests performed.
Testbed setup
We used the following hardware and software configurations to conduct our tests:
1 Dell R750XA server
2 NVIDIA A100 GPUs, each with 80GB memory
NVIDIA vGPU driver v17 (550.54)
vSphere 8.0 U3
VM operating system: Ubuntu 22.04
Each VM had:
16 virtual CPUs
64GB of memory
1TB hard disk drive
The test scenarios, which we split into single VM and multi-VM (concurrent) tests, included a range of pre-defined NVIDIA GPU GRID MIG and vGPU profiles. We ran the tests on Meta Llama 2 7B and 13B non-quantized models. We took the test samples from the open source Hugging Face GitHub repository with modified prompts, and we defined the load as the number of prompts per batch as input. Each request was repeated 50 times. The single-VM and multi-VM tests were regularly run sequentially on the latest ESXi build.
The following tables show the performance test coverage.
Table 1. Llama 2 performance regression automation scenarios in a single VM
The multi-VM scenarios included two categories: one with 2 VMs and the second with 3 VMs. We ran the Llama 2 tests on 2 VMs concurrently on variations of the MIG A100 profiles for two VM scenarios: VM1 had the 3-40 GRID profile, and VM2 had 4-40c. When we scaled the test to 3 VMs, VM1 had 3-40c, while VM2 and VM3 each had 2-20c.
Single VM results
The following three graphs summarize the throughput and latency of the tests performed on a single VM. They highlight the data points from all the MIG vGPU profile tests, as mentioned in table 1, with the 7B model and two types of loads with input batch sizes of 32 and 64.
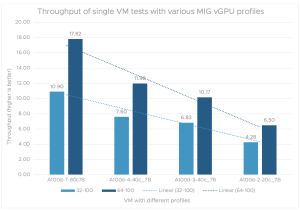
Figure 1 shows the throughput from tests on a single VM with varied MIG profiles. We define throughput as the total number of prompts passed divided by the total time taken. Prompts are tasks or examples of tasks from the dataset that the model should learn.
We can see that a single VM with the MIG vGPU 7-80C profile on the 7B model achieves the highest throughput. As expected, throughput consistently declines (almost linearly) as we decrease the number of compute instances and memory from the MIG vGPU profile.
Figure 1. Throughput of single VM tests with various MIG vGPU profiles
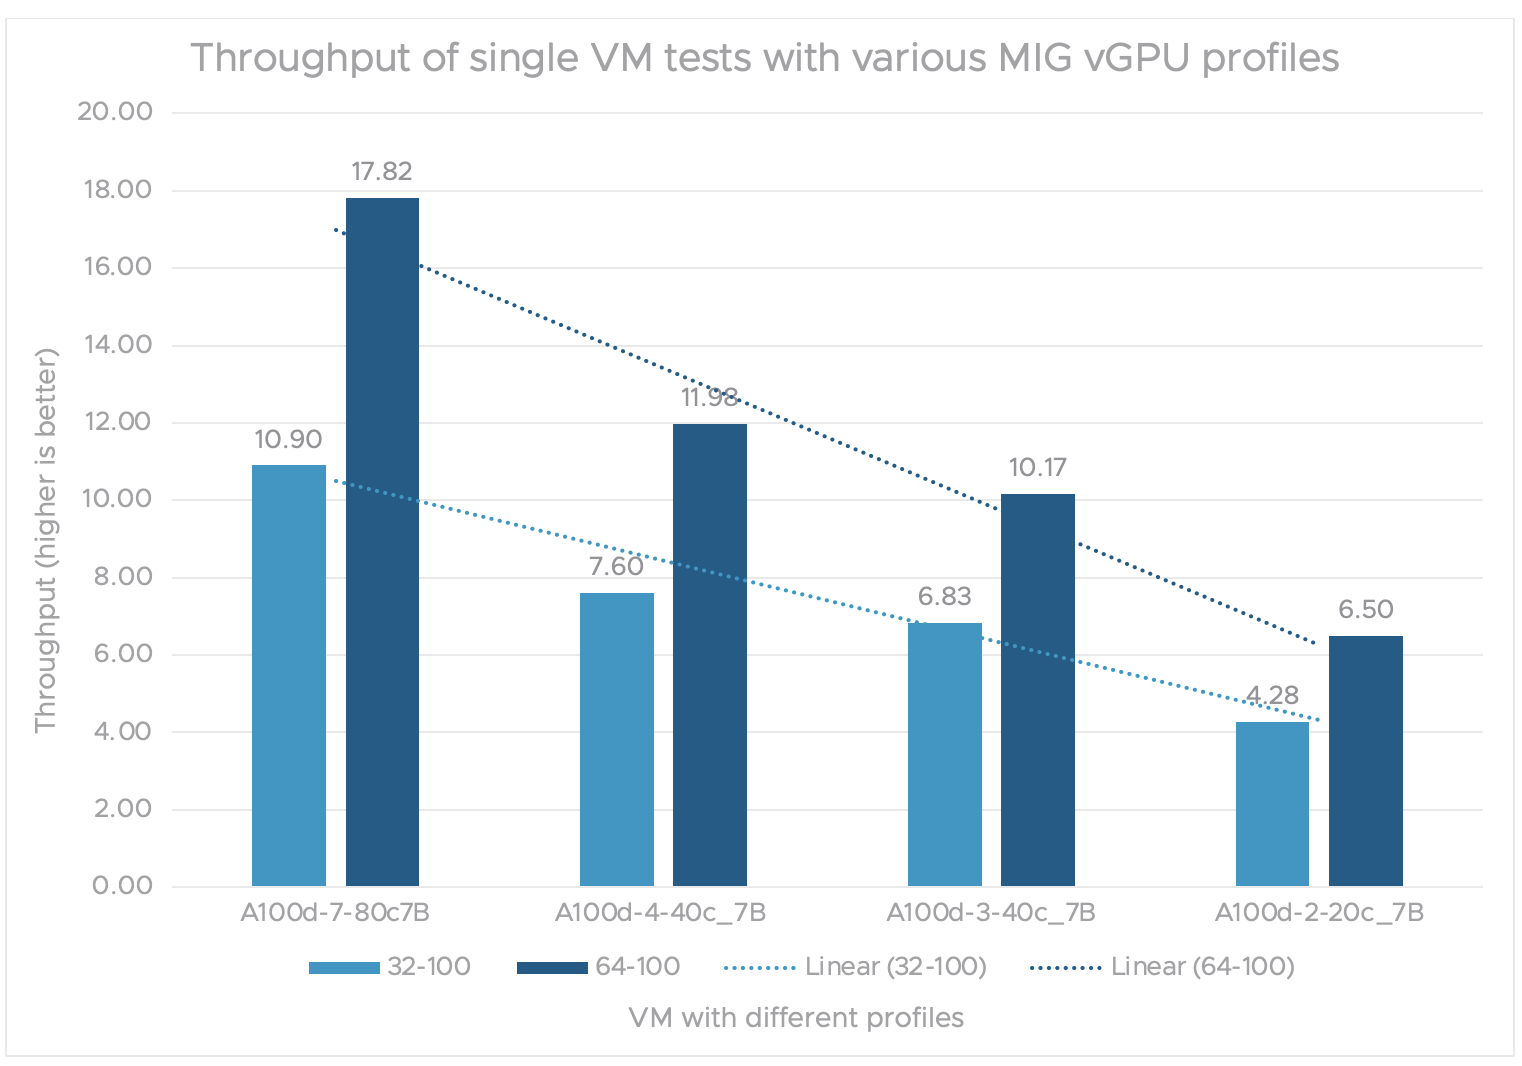
Figure 2 shows the median latency for tests done on a single VM with varied MIG vGPU profiles. We define latency as the time taken to receive a response from an inference request.
As we have seen with throughput, the latency is minimal for a single MIG vGPU 7-80c profile on the 7B model. Latency increases almost linearly as we reduce the number of compute resources and memory from the MIG vGPU profiles.
Figure 2. Median latency of single VM tests with various MIG vGPU profiles
Multi VM concurrency
The following graphs show the multi-VM concurrency baseline results as measured by throughput and median latency. They highlight the data points from all the MIG vGPU profile tests, as shown in table 2, with the Llama 2 7B non-quantized model with input batch sizes of 32 and 64 for the load types.
Scenario 1
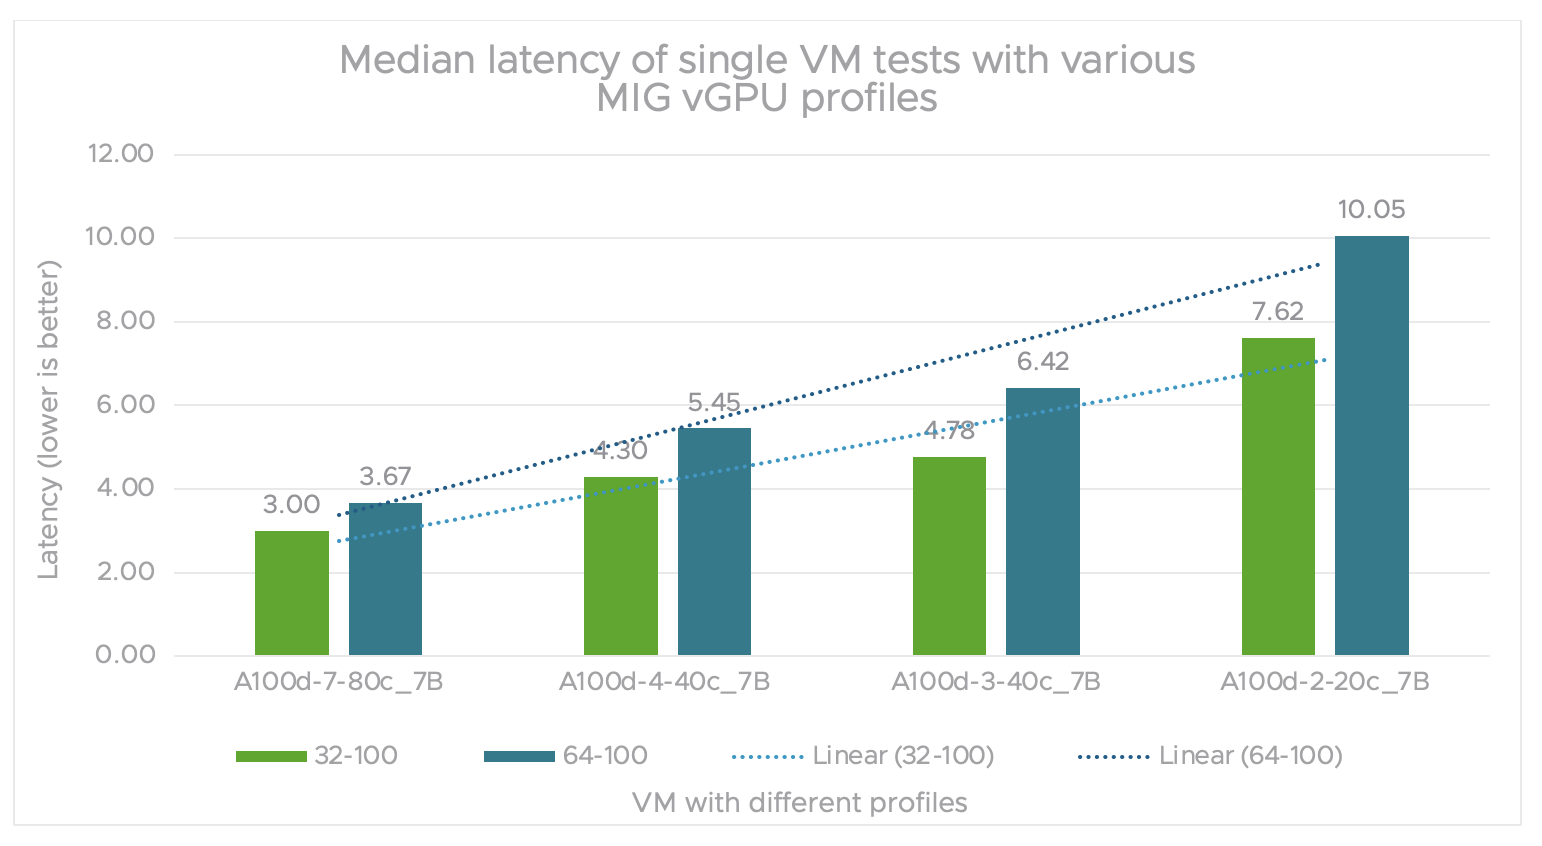
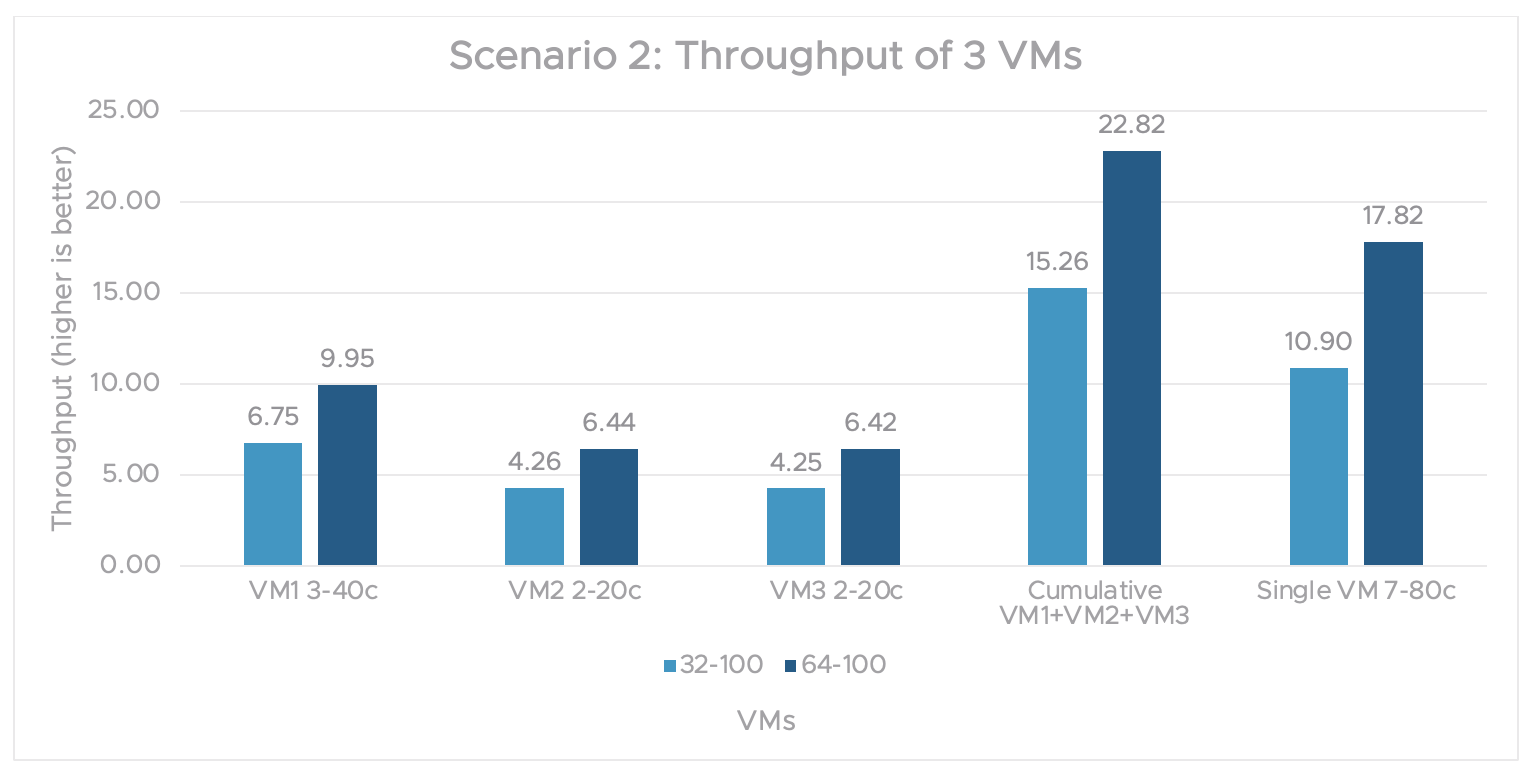
In figure 3, workload throughput values for individual VMs are plotted with an input 32 token length and an output 100 sequence length. In this scenario, 2 VMs run the Llama 2 7B model and concurrently share 1 physical GPU.
The cumulative throughput from both VMs is compared to a single VM’s throughput. The VMs use A100-3-40c and A100-4-40c MIG vGPU profiles from the same physical GPU. The cumulative performance of multiple VMs sharing one GPU is 22%-30% better than that of a single VM with the full A100 GPU capacity.
Figure 3. Scenario 1 graph showing the throughput of 2 VMs
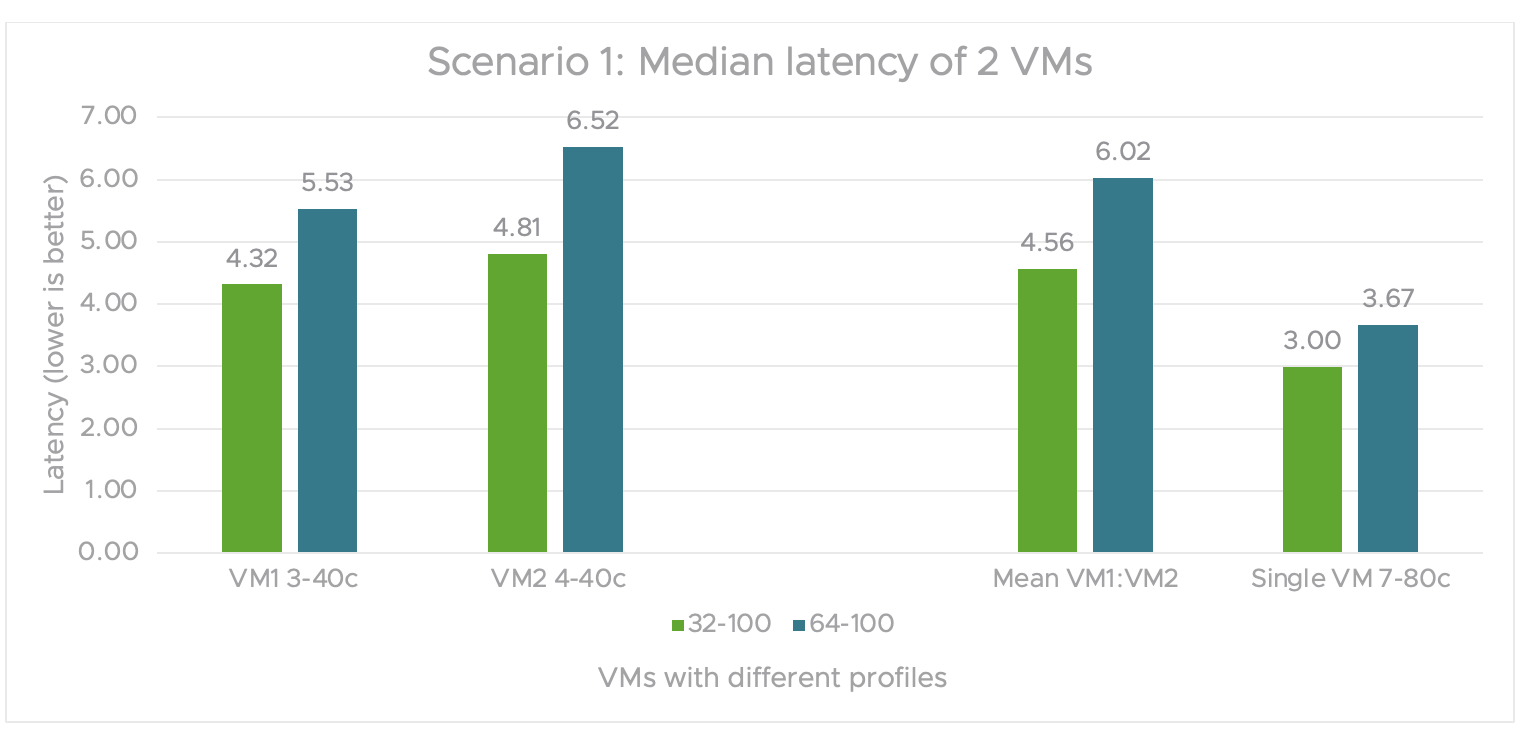
Figure 4 shows the median latency of 2VMs. The individual VM latency values are plotted with input 32 token length and output 100 sequence length. This scenario has two VMs running the Llama 2 7B model and concurrently sharing one physical GPU.
The mean latency of both VMs is compared to the overall latency of the single VM with 1 A100-80 MIG vGPU profile. The overall latency of both loads is similar in 1 VM and is less than the mean latency of 2 VMs running the Llama 2 7B model concurrently.
Figure 4. Scenario 1 graph showing the median latency of 2VMs
Even though the cumulative throughput is 22%-30% better with multiple VMs sharing a single GPU compared to a single VM consuming one full GPU, there is a 55%-65% degradation in latency with the multiple VM test case compared to a single VM.
Scenario 2
In figure 5, we scaled out from 2 VMs to 3 VMs. (2 VMs had a 2-20c MIG vGPU profile and 1 VM had 3-40c). We also compare the 3-VM test to that of the single VM with an A100 7-80c (full capacity) MIG vGPU profile.
Figure 5. Scenario 2 graph for the throughput performance of 3 VMs
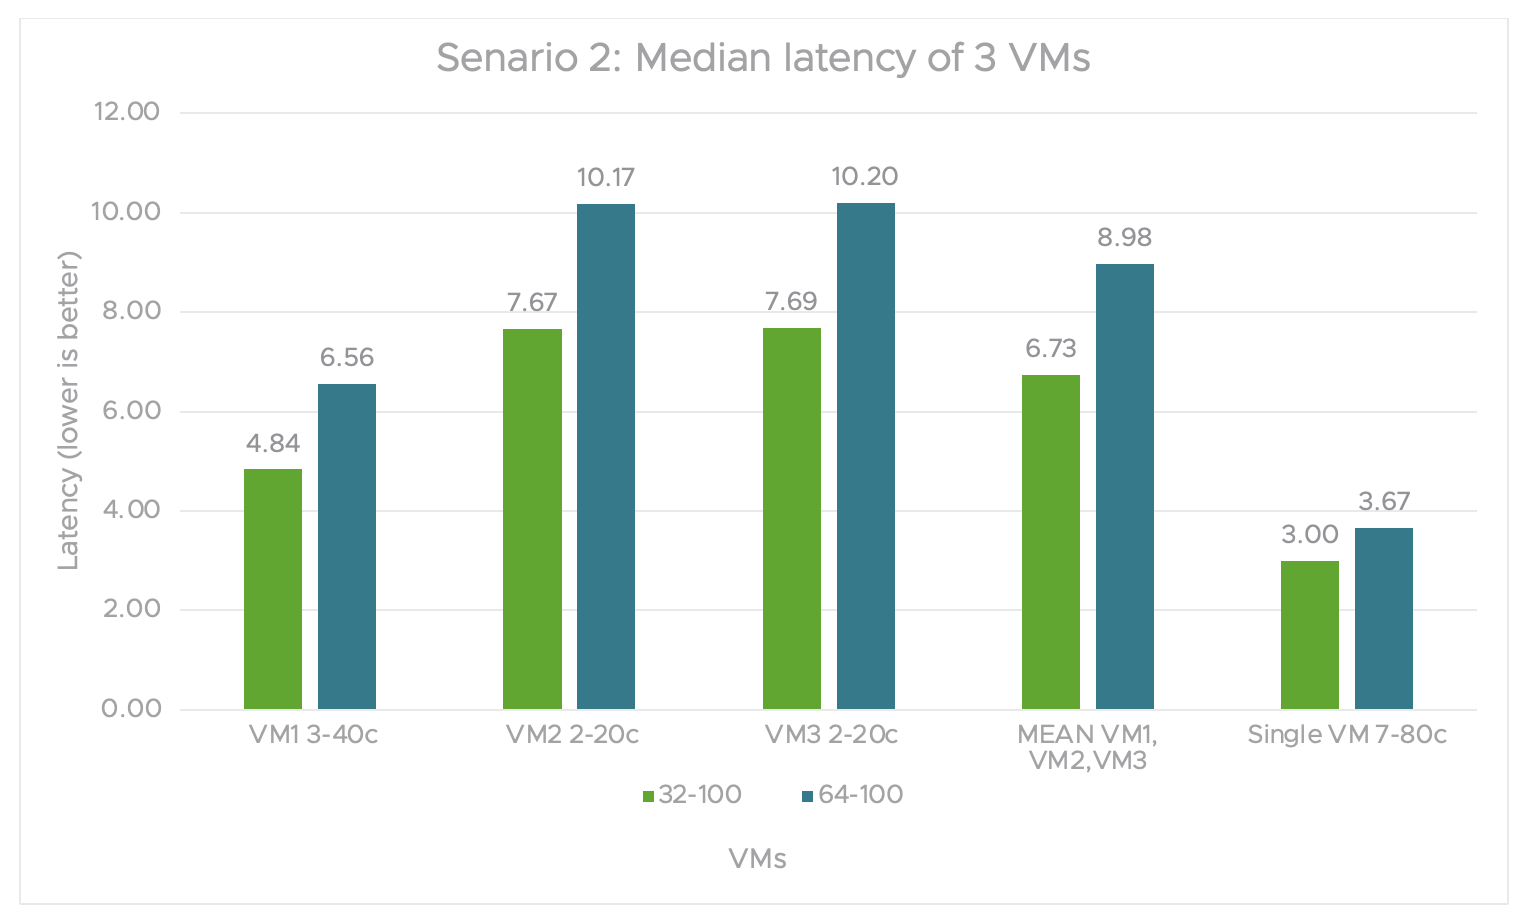
In figure 6, the median latency of all three VMs is larger than that of the single VM for both load types. For either load, the latency didn’t vary much. In the single VM test, there’s a considerable difference in multiple VM tests for smaller profiles. The percentage difference between the median latencies of all three VMs vs single VM latency goes up to 145% and increases with the increase in load.
Figure 6. Scenario 2 graph for the median latency of 3 VMs
Even though the throughput is much better with multiple VM tests under increasing loads, the latency difference increased from scenario 1 as we scaled up the number of VMs from 2 to 3. The latency continues to increase with higher load. The percentage increase of latency with changing load for 1 VM is 18%, and it’s up to 26% for 3 VMs.
Conclusion
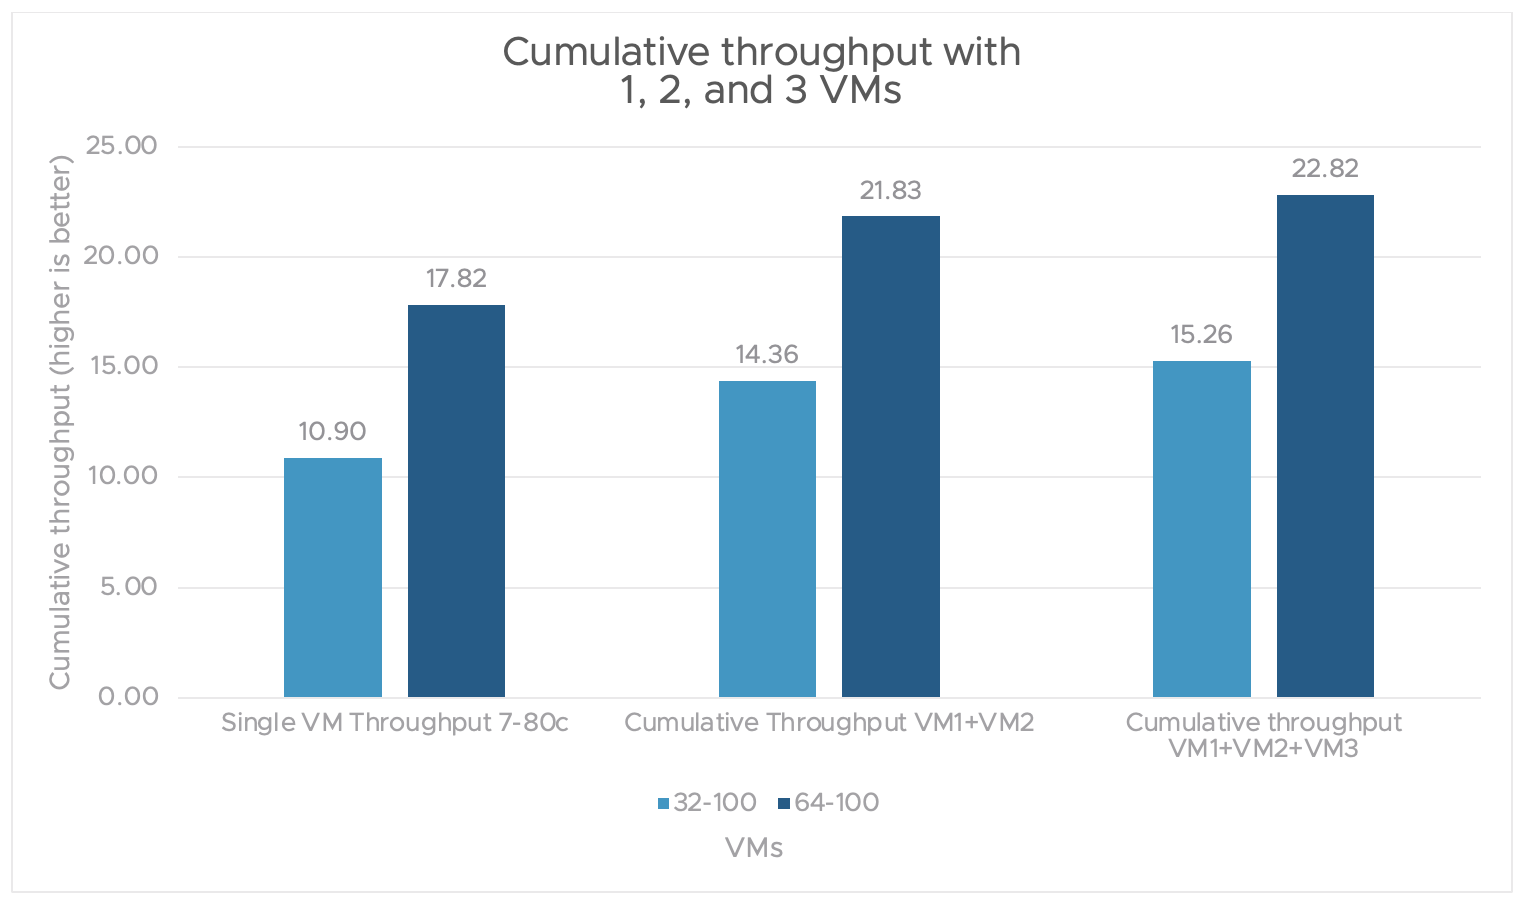
As shown in figure 7, throughput increases when scaling up the number of VMs. This is done without adding any hardware.
Figure 7. Cumulative throughput with 1 VM, 2 VMs, and 3 VMs
The trade-off is a slight increase in the median latency. However, you have a choice. if you prioritize throughput, you can use multiple VMs to meet your performance needs. On the other hand, if you prioritize latency, you can use a single VM.