“Micro-Segmentation provides a way to build a zero-trust network – where all networks, perimeters and application are inherently untrusted.” – declared Forrester Consulting in 2015 with their white paper Leveraging Micro-Segmentation to build zero-trust model. The last mile in creating a truly zero-trust network implies not trusting each application and also tiers within an application (Figure 1). To complete the last mile, network, security and risk professionals are increasingly looking for tools to understand application communication patterns and providing access controls to them. With version 6.3.0, NSX has unveiled 2 new tools, namely, Application Rule Manager (ARM) and Endpoint Monitoring (EM), to help professionals understand application patterns.
 Figure 1: Zero-Trust Model using NSX
From Theory to Practice
Micro-Segmenting each application requires understanding of application communication patterns. Users should allow the flows required by the application. To accomplish zero-trust, users should be closing all unwanted flows & ports. Figure 2., is a sample practical firewall policy model to achieve that. In this model, ARM/EM provides application patterns and a one-click conversion of those patterns into distributed firewall rules to achieve inter/intra application rules.
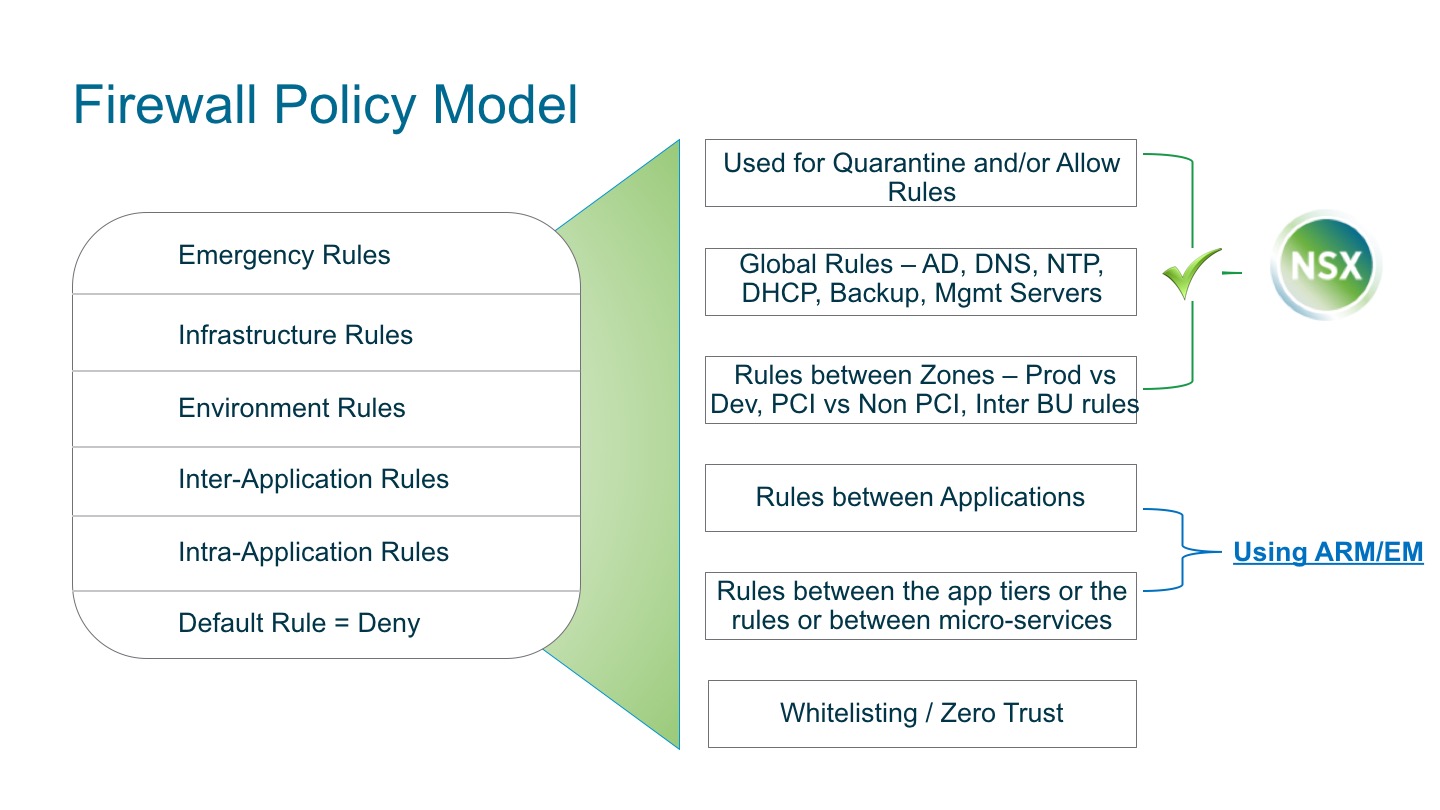 Figure 2: Firewall Policy Model
Generating Distributed Firewall Rules Rapidly
Any application in the datacenter can be put in a monitoring mode to capture the raw 5-tuple flow in NSX. Application Rule Manager can auto-analyze these raw flows and provide an intelligent view of the patterns. These analyzed patterns can now be used to create distributed firewall rules with one-click. It can be used with both new applications being on-boarded or existing applications that are already deployed. Both allowed flows and blocked flows due to existing firewall rules. This helps in not just creating new firewall rules, but also enables you to analyze existing rules and change them for the application to work.
Analyzing what your application does in your datacenter and not just providing raw flows – makes Application Rule Manager very potent. It replaces raw IP addresses seen on the wire with actual VMs that the application is communicating to. It shows the details of the VMs – which Security Group it is part of, which Security Tags are attached with it. It understands the nature of flows not only in terms of the port and protocol but also ALGs (application level gateways) so that multiple flows consolidate to a single pattern. It auto-suppresses broadcast and multicast flows for targeted application level flows. And finally, it allows you to create Security Groups and Distributed Firewall Rules that can be published for that application.
Enhanced Visibility – with Endpoint Monitoring
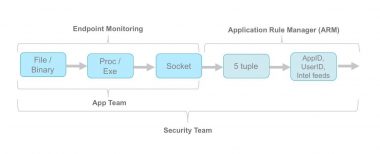
We did not just stop at the wire for providing application patterns. NSX 6.3.0 introduces Endpoint Monitoring that goes a level deep into the nature of an application. It provides you a way to see processes inside a VM that are making network communications. With Endpoint Monitoring – you can see which processes are listening on which ports and which processes are making active connections. You can also see the details of the processes – for example – process name, application name, version number. In short you can go beyond the wire to construct your information as “A SQL client of version <x.xx> in VM1 is opening a network connection and communicating with a SQL server of version <y.yy> in VM2.
Figure 3: End to End Visibility
Application Rule Manager for real Applications
Users who had early access bits have been running this for a while. One user used ARM to micro-segment Skype Application. In 20 minutes of monitoring by ARM, the user saw 2.5K raw flows, which was analyzed by ARM and consolidated to around 300 unique flows. From there ARM, provided information that only 79 flows did not hit any existing firewall rules and finally the user created a very small set of firewall rules for those 79 flows. Another user, used ARM for micro-segmenting the entire Pivotal Cloud Foundry infrastructure. A user exclaimed with Endpoint monitoring, that he can now solve his current firewall ticket by providing the application owner – which process of his application is actually getting blocked due to distributed firewall.
We will provide you more stories as we hear them in the coming days of users using them and telling us. We encourage you all to tell us your experiences with the tool. And finally, a sneak preview if you would like to test-drive a new feature – see Layer 7 information about a flow – that will be released later this year in ARM/EM please contact me.
As I sign off for today – I am adding links to a you-tube video on how Application Rule Manager works, and a blog on ARM helped micro-segment an application like a Electronic Medical Record (EMR) Application.
- YouTube Video on ARM
- Practical Implementation using ARM of an EMR Application – Healthcare.

Comments
0 Comments have been added so far